Application of the Error Indicator
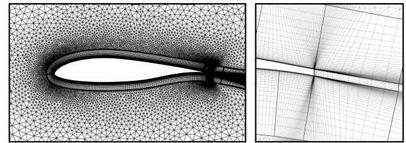
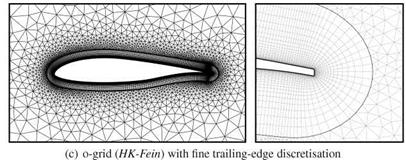
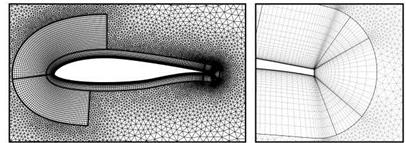
The verification of the error indicator was conducted on six grids. The first four of them are grids of the NLF(0)416 airfoil with a blunt trailing edge. The grid cBTE in Figure 10(a) is the reference grid which is of c-type. The grid HK-Grob in Figure 10(b) is an o-grid with a coarse trailing-edge discretization. The grid HK-Fein shown in Figure 10(c) has a finer trailing-edge discretization. This was achieved by increasing the number of grid points along the trailing edge. The grid HK-EV in Figure 10(d) is a further improved version of the previous grid. The number of grid points on the trailing edge was further increased and the sharp trailing edge corners were rounded by the placement of radii. In addition, the structured layer around the first third of the airfoil was enlarged. The last two grids have sharp trailing edges and are of c-type. These are the grids 1x and 8x.
|
(a) c-grid (cBTE) |
|
(b) o-grid (HK-Grob) with coarse trailing-edge discretisation |
|
|
|
(d) o-grid (HK-EV) with rounded trailing-edge corners Fig. 10 Grids for the error indicator tests |
|
Fig. 11 Flow condition at the vicinity of the trailing edge at two different levels of grid resolution |
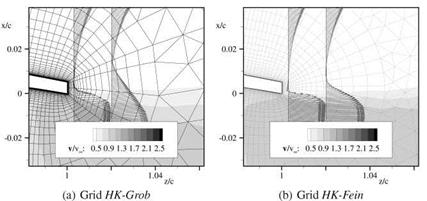
On these six grids, the solution was gained for Re = 4 • 106, Ma = 0.1 for a = 4° to 14°. For turbulence modelling the SST-model was used. For the grid HK-Grob the flow features at the trailing edge are of primary interest. Therefore the features of the flow field at a = 14° are shown in Figure 11(a). At this angle of attack a trailing edge separation is present. Velocity profiles downstream of the trailing edge are shown along two stations with x = const. Due to the o-type grid the resolution in the wake rapidly coarsens which explains why the velocity gradients vanish correspondingly. At a = 14°, HK-Grob deviates by 4.50 lift counts and 12.0 drag counts from the lift and drag coefficients obtained on cBTE.
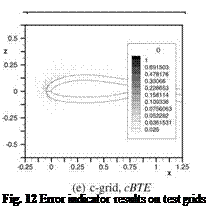
In case of HK-Fein, shown in Figure 11(b), the resolution at the trailing edge is finer which leads to a better resolution of the velocity profiles downstream. To test the applicability of the error indicator on poorly resolved trailing edges, it was applied to HK-Grob and HK-Fein. The error indicator outputs are compared in Figures 12(a) to 12(d).
Areas that have a small contribution to the discretization error are of light colour whereas areas that have a high contribution are dark coloured. Compared to HK – Grob the grid cBTE has low error values across the whole wake region. The grid HK-Grob is showing a higher level of indicated error along the wake flow field, where the error magnitude increases close to the trailing edge. Due to the free shear layers high gradients at the vicinity of the trailing edge are present. These gradients are poorly resolved by the present coarse grid. Especially at the sharp trailing-edge corners the flow physics yield very high gradients which lead to high values of added artificial dissipation and thus to a high indicated discretization error. As one can see in Figure 12(c) and 12(d) a slight refinement of the wake region by increasing the number of grid points along the trailing edge leads to a significant decrease of the indicated discretization error. However, regions with high error values still persist especially at the lower sharp corner of the trailing edge. At this corner the slow trailing edge flow joins the much faster flow of the lower surface. As a consequence,
 |
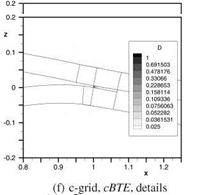 |
high gradients occur which explain the high indicated error values. Furthermore, the plots reveal that on both HK-Grob and HK-Fein errors in the unstructured parts of the wake flow and near the leading edge are indicated. This is also attributed to the fact, that the unstructured grid can not sufficiently resolve flow gradients.
A close view of the grid at the trailing edge reveals that the corner cells are highly skewed. This skewness is a trade-off to the sharp trailing edge corners. In
order to improve the mesh around the corners, the grid HK-EV in Figure 10(d) was generated.
In Figure 13(a) the output of the error indicator is shown for this improved grid. Figure 13(b) gives a more detailed depiction of the trailing edge region. Comparing the results for HK-EV and HK-Grob reveals that a significant reduction of the indicated error could is achieved by this grid generation techniques. This is pointed out by the output of the error indicator at the corners in Figure 13(c) and 13(d). In particular the error contribution of the grid at the first third of the airfoil was reduced by enlarging the hexahedral part of the grid as well as through the improvements made near the trailing edge.
Optimizing the trailing edge discretization yields an improvement of 3.0 lift counts and 9.0 drag counts, thus reducing deviations in q and cd to 1.50 lift counts and 3.0 drag counts, respectively (deviations from HK-Fein to cBTE). Enlarging the structured layer at the first third of the airfoil yields a further reduction of 2.0 drag counts.
In Figure 14(a) and 14(b) the results of the error indicator on the grids 1x and 8x with sharp trailing edge are shown. Like in the previous cases, regions of increased indicated error are highlighted at the grid region covering the first third of the airfoil. However, the high indicated errors down – and upstream of the trailing edge are of particular interest for this case. These errors are mainly caused by the gradients of the boundary layer and the free shear layer, respectively. Compared to the reference grid 8x the grid 1x with the thin structured layer has an error of 4.0 lift counts and
8.0 drag counts.
The near-wall velocity profiles as well as the wake velocity profiles are depicted at seven stations along x. At the left-most station @ the boundary layer is still within the structured grid part. At the following slices (© to (A) the boundary layer is growing into the unstructured grid part, so the indicated error is growing as well. The indicated error value has a high magnitude at regions with high gradients (A to (A). In the wake the error values are fading out since the gradients disappear (cf. (A and AG). On the grid 8x in Figure 14(b), no errors can be observed.


