CORRELATION FUNCTION
The correlation function (or covariance) of two functions vft) and vs(t) is defined as
Ліг(т) = <*>i (t)vz(t + t)) (2.6,5)
i. e. as the average (ensemble or time) of the product of the two variables with time separation r. If vft) = v^(t) it is called the autocorrelation, otherwise it is the cross-correlation. If r = 0 (2.6,5) reduces to
![]()

^ia(O) = (vi ®a)
and the autocorrelation to
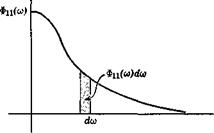
Fig. 2.7 Spectrum function.
Thus the area under the curve of the spectrum function gives the mean – square value of the random variable, and the area Ф(<у) dco gives the contribution of the elemental bandwidth dco (see Fig. 2.7).
In order to see the connection between the spectrum function and the harmonic analysis, consider the mean square of a function represented by a Fourier series, i. e.
V2(T) = — [Tvt)dt 2TJ-t
1 Гт / 00
^ — I 2 An cos nco0t + Bn sin nco0t 21 J—T n=o
![]()
 |
00 •
A m cos mcOffi + Bm sin mco0t dt
m=0 /
Because of the orthogonality property of the trigonometric functions, all the integrals vanish except those containing A 2 and B2, so that
V* = 1№п + Bn2) (2.6,12)
72 = 0
From (2.3,126), A2 + B2 = 4 |Cy2, whence
— 00 00 00
»2 = 21 Cn2 = 2 l^nl2 = 2 C*nCn (2.6,13)
w=0 7i=—oo n=—oo
where the * denotes, as usual, the conjugate complex number.
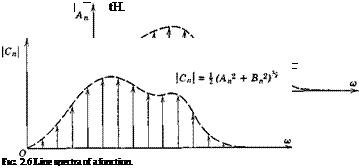
The physical significance of Gn2 is clear. It is the contribution to v2 that comes from the spectral component having the frequency nco0. We may rewrite this contribution as
Now writing a>„ = bco and interpreting bv2 as the contribution from the hand width (n — J)co0 < a> < (n + h)OJo> we have
— n*rt
![]() ЬУ = S-і bw
ЬУ = S-і bw
The summation of these contributions for all n is v2, and by comparison with (2.6,11) we may identify the spectral density as

![]() G*C
G*C
Фи(а>) = lim n n
to0->0 ft>0
More generally, for the cross spectrum of and ;
G*C, *o ft>0
Now in many physical processes v2 can be identified with instantaneous power, as when v is the current in a resistive wire or the pressure in a plane acoustic wave. Generalizing from such examples, v2(t) is often called the instantaneous power, v2 the average power, and Фп(со) the power spectral density. By analogy Ф12(со) is often termed the cross-power spectral density.
From (2.6,9), and the symmetry properties of Il12 given by (2.6,86), and by noting that the real and imaginary parts of e~i<OT are also respectively even and odd in т it follows easily that
Фі2(о>) = Ф*і(<п) (2.6,17а)
The result given in (2.6,17) is sometimes expressed in terms of Fourier transforms of truncated functions as follows. Let v{(t; T) denote the truncated function
v((t;T) = vt(t) for 111 < T
v((t;T) =0 for Ы > T (2.6,18)
|
|
he the associated Fourier transform. Comparing (2.6,19) with (2.3,1) in Table 2.1 (w = nm0) we see that
![]()
![]() С1п = ^У,(псо0;Т) Ztt
С1п = ^У,(псо0;Т) Ztt
Фізм =lim V*(nco0; T) ■ V,(noJa; T)
U)n-*0 4:77
On substitution of co0 = tt/T and со = ncog, this becomes finally,
 (2.6,22a)
 |
CORRELATION AND SPECTRUM OF A SINUSOID
After integrating and taking the limit, the result is the cosine wave
![]() R(t) = — cos Or
R(t) = — cos Or
2
It follows that the spectrum function is 1/2-7Г times the Fourier transform of (2.6,23), which from Table 2.2 is
![]() (2.6,23 a)
(2.6,23 a)
i. e. a pair of spikes at frequencies ±£2.


