CHARACTERISTICS OF SPECIFIC AIRFOILS
The generalized characteristics and parametric analysis of airfoils given above is suitable for initial studies of configurations and developing an overall understanding. For specific applications the characteristics of the specific airfoil to be used are needed operating at Reynolds and Mach numbers as near the actual condition as possible. While there have been great strides in the development and use of airfoil theory with high speed computor (40,a, b), actual test results are still preferred for final analysis. The use of the computor has resulted in a new series of airfoils which give important improvements in performance for wings, rotors and any other air-moving device. Since the lift characteristics of two dimensional airfoils are necessary for design of all types of wings the characteristics of specific airfoils and specialized operating conditions will be considered in this section considering only two dimensional airfoil characteristics eliminates the three dimensional characteristics which are covered in the chapters on the various wing types. [29] [30]
|
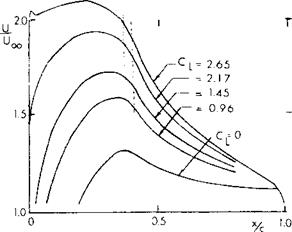
Figure 32. Relative velocity distribution for an airfoil’designed high CLX (FX 74-CL 5 – 140). Dotted lines enclosed observed length of laminar separation bubble. |
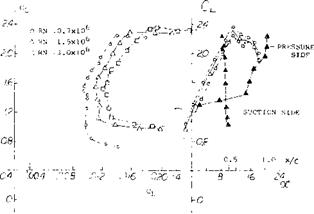
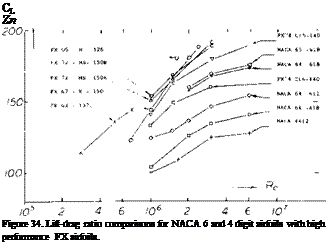
Concave Pressure Distribution. Since the development of the laminar airfoil sections (38,b) a need for higher critical Mach number, improved Cux and lower drag has existed. To satisfy this need new airfoils have been developed by a number of investigators including Whitcomb, Wortman, Liebeck and others (42). In the development of these airfojls, theoretical methods were used to obtain the pressure distribution as well as the prediction of separation of turbulent boundary layer. As discussed in (42,a) the maximum lift is determined by the interaction of the upper surface pressure distribution and the boundary layer. A turbulent boundary layer is needed to obtain the necessary pressure recovery. This is achieved by a concave pressure distribution with a more or less flat forward part, as illustrated on figure 32. The lift characteristics of such an airfoil illustrated in figure 33 show CLX = 2.38 and L/Dx = 140 and a c’u5 /CD of 200 at R = 10c. The L/D for the “concave” pressure airfoils are compared with the 6 series on figure 34 as a function of Reynolds number and prove the value of the design approach.
|
A IS TRANSITION POSITION
Figure 33. Drag polar of FX 74-CL5-140 for Reynolds number 1.0, 1.5 and 3.0 (10) . |
 |
 |
 |
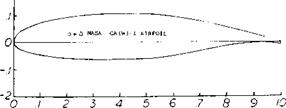
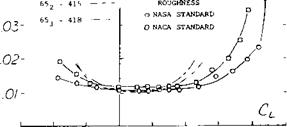
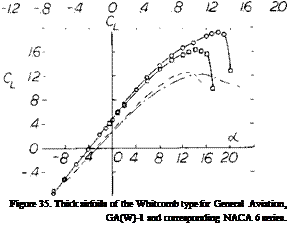
General Aviation – Airfoils. Airfoils suitable for general aviation aircraft should have a gentle stall characteristic, low drag and fairly high thickness ratios for an improved structure and thus a reduction of wing weight. Based on the general design concepts for low drag supercritical airfoils, a new airfoil was designed using the computer study of (40,a, b) and wind tunnel tests (43,a). The test data of the NASA GA(W)-1, Whitcomb airfoil indicated important improvements of the drag and CL>( characteristics, figure 35, thus validating the theoretical approach. The application of this airfoil with flaps (43,b) shows that a maximum lift coefficient of 3.8 can be achieved with a 30% chord Fowler flap, no leading edge devices and no blowing.
SAILPLANES. As pointed out in (48,a) design conditions for the wing of a sailplane are different from those for a powered aircraft: (a) The aspect ratio is “very” high, in the order of 20 or 25, for glide performance, (b) The Reynolds number is comparatively low, between 1(10) when circling (around 50 mph, at C =0.8) and 2(10) when cruising (at V = 100 mph, and C =0.2), (c) Absence of engine vibration and noise. — These three considerations call for, and make possible, the use of comparatively thick and cambered laminar-type airfoil sections. A large selection of airfoils suitable for sailplanes is given in (42,a, c). The characteristics of a typical high performance airfoil is on figure 33.
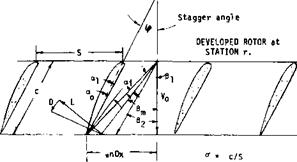
CASCADES: In those applications such as propellers and axial flow compressors, the airfoils effectively follow one another and so operate as a cascade, figure 37. The function of the cascade of airfoils is to create a pressure rise. If the cascade is operating between walls where the axial velocity does not change the pressure rise is developed as a result of the turning of the flow by the cascade. When the spacing between the airfoils is large compared to the airfoil chord, low solidity, and the sections are between walls the lift and drag characteristics approach that of the two dimensional airfoil. When the solidity is high however there is a interaction between the airfoil sections and the overall characteristics of the sections change. Cascade airfoil tests are conducted to determine the performance of the sections as a function of stagger angle, solidity and airfoil type. Because of the limited scope of the cascade airfoil data it is desirable to determine corrections for the application of two dimensional airfoil data to cascade conditions.
(44) Results on practical-construction airfoils:
a) Tetervin, Helicopter Blades, NACA W Rpt L-643.
b) Doetsch, Waviness 23012, Ybk D Lufo 1939 p 1-88.
c) NACA, TN 428 (fabric), 457 (irregularities), 461 (rivet heads), 724 (rib stitching); 1932.
d) Quinn, Practical Construction, NACA T Rpt 910. [31] [32] [33] [34] [35]
|
Figure 37. Cascade airfoils and velocity triangle. |
Airfoil data is applied in the design of propellers by determining the angle required to correct the three dimensional conditions of the propeller to the two dimensional flow conditions of the airfoil (49e). These angle corrections account for the loading, the blade number, operating condition and span condition including tip effects. In the case of a rotor operating between walls the angle correction for applying two dimensional airfoil data can be determined from the equation
<rCL= 2cos(/S/ – cCi)(Ump/ – tan(^ – 2<*i) (22)
where cr = the blade solidity = cB/lTxD = c/s CL= operating lift coefficient – 2/d У = inlet stagger angle <*i = induced angle of attack
The two dimensional angle of attack is found from the equation
a = A ~ W – oft
Here d, is the angle between the rotor blade chord line and the inlet vector, figure 37. In the application of the above equations the lift and drag coefficients are determined from the two dimensional airfoil data at the angle of attack of or. The lift and drag is calculated from these coefficients using the mean velocity vector W to find the dynamic pressure. Good agreement between the cascade test data and cr CL calculated with equation 22 is obtained for all section cambers and stagger angles up to camber solidities of 1.5
The cascade data (49, f) indicates the lift curve slope decreases with increasing solidity and inlet angle, . Based on these data the slope of the lift curve of the two dimensional airfoil, m, becomes, m’, when operating in a cascade and is found from the equation
m’ = m(l + (*.00645/3, – .2352 – -3121cr + .05859a*)
(49) Cascades of foils, vanes, blades, propellers
e) Borst, High and Intermediate Solidity Fans, NASA CR 3063.
f) Emery, et al, Cascade tests NACA 65 sections, NACA TN 1368.


