Introduction
Aircraft conceptual design starts with shaping an aircraft, finalizing geometric details through aerodynamic considerations in a multidisciplinary manner (see Section 2.3) to arrive at the technology level to be adopted. In the early days, aerodynamic considerations dictated aircraft design; gradually, other branches of science and engineering gained equal importance.
All fluids have some form of viscosity (see Section 3.5). Air has a relatively low viscosity, but it is sufficiently high to account for its effects. Mathematical modeling of viscosity is considerably more difficult than if the flow is idealized to have no viscosity (i. e., inviscid); then, simplification can obtain rapid results for important information. For scientific and technological convenience, all matter can be classified as shown in Chart 3.1.
This book is concerned with air (gas) flow. Air is compressible and its effect is realized when it is flowing. Aircraft design requires an understanding of both incompressible and compressible fluids. Nature is conservative (other than nuclear physics) in which mass, momentum, and energy are conserved.
Aerodynamic forces of lift and drag (see Section 3.9) are the resultant components of the pressure field around an aircraft. Aircraft designers seek to obtain the maximum possible lift-to-drag ratio (i. e., a measure of minimum fuel burn) for an efficient design (this simple statement is complex enough to configure, as will be
observed throughout the coursework). Aircraft stability and control are the result of harnessing these aerodynamic forces. Aircraft control is applied through the use of aerodynamic forces modulated by the control surfaces (e. g., elevator, rudder, and aileron). In fact, the sizing of all aerodynamic surfaces should lead to meeting the requirements for the full flight envelope without sacrificing safety.
To continue with sustained flight, an aircraft requires a lifting surface in the form of a plane – hence, aeroplane (the term aircraft is used synonymously in this book). The secret of lift generation is in the sectional characteristics (i. e., aerofoil) of the lifting surface that serve as wings, similar to birds. This chapter explains how the differential pressure between the upper and lower surfaces of the wing is the lift that sustains the aircraft weight. Details of aerofoil characteristics and the role of empennage that comprises the lifting surfaces are explained as well. The stability and control of an aircraft are aerodynamic-dependent and discussed in Chapter 12.
Minimizing the drag of an aircraft is one of the main obligations of aerodynami – cists. Viscosity contributes to approximately two-thirds of the total subsonic aircraft drag. The effect of viscosity is apparent in the wake of an aircraft as disturbed airflow behind the body. Its thickness and intensity are indications of the extent of drag and can be measured. One way to reduce aircraft drag is to shape the body such that it will result in a thinner wake. The general approach is to make the body in a teardrop shape with the aft end closing gradually, as compared to the blunter front-end shape for subsonic flow. (Behavior in a supersonic flow is different but it is still preferable for the aft end to close gradually.) The smooth contouring of teardrop shaping is called streamlining, which follows the natural airflow lines around the aircraft body – it is for this reason that aircraft have attractive smooth contour lines. Streamlining is synonymous with speed and its aerodynamic influence in shaping is revealed in any object in a relative moving airflow (e. g., boats and automobiles).
New aircraft designers need to know about the interacting media – that is, the air (i. e., atmosphere). The following sections address atmosphere and the behavior of air interacting with a moving body.
 Viscosity (m/s)
1.0
Density – kg/m
I 300
Speed of sound (m/s)
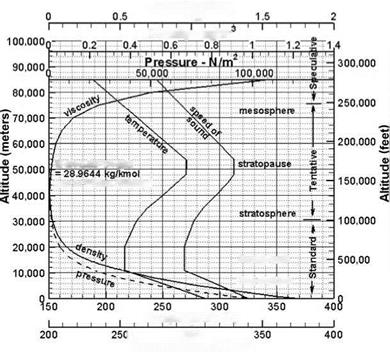
Figure 3.1. Atmosphere (see Appendix B for accurate values)
3.2 Atmosphere
Knowledge of the atmosphere is an integral part of design – the design of an aircraft is a result of interaction with the surrounding air. The atmosphere, in the classical definition up to 40-kilometer (km) altitude, is dense (continuum): Its homogeneous constituent gases are nitrogen (78%), oxygen (21%), and others (1%). After substantial data generation, a consensus was reached to obtain the ISA [1], which is in static condition and follows hydrostatic relations. Appendix B includes an ISA table with up to 20-km altitudes, which is sufficient for this book because all aircraft (except rocket-powered special-purpose aircraft – e. g., space plane) described would be flying below 20 km. Linear interpolation of properties may be carried out between low altitudes. At sea level, the standard condition gives the following properties:
pressure = 101,325 N/m2 (14.7 lb/in2) temperature = 288.16°K (518.69°R) viscosity = 1.789 x 10⁻⁵ m/s (5.872 x 10⁻⁵ ft/s) acceleration due to gravity = 9.81 m/s2 (32.2 ft/s2)
In reality, an ISA day is difficult to find; nevertheless, it is used to standardize aircraft performance to a reference condition for assessment and comparison. With altitude gain, the pressure decreases, which can be expressed through the use of hydrostatic equations. However, temperature behaves strangely: It decreases linearly up to 11 km at a lapse rate of 6.5°K/km, then holds constant at 216.66°K until it reaches 20 km, at which it starts increasing linearly at a rate of 4.7°K/km up to
47 km. The 11-km altitude is called the tropopause; below the tropopause is the troposphere and above it is the stratosphere, extending up to 47 km. Figure 3.1 shows the typical variation of atmospheric properties with altitude. The ISA is up to 100,000-ft altitude. From 100,000- to 250,000-ft altitude, the atmospheric data are currently considered tentative. Above a 250,000-ft altitude, variations in atmospheric data are speculative.
Typical atmospheric stratification (based primarily on temperature variation) is as follows (the applications in this book do not exceed 100,000 ft [«30.5 km]):
 up to 11 km (36,089 ft)
11 km (36,089 ft)
from 20 to 47 km (65,600 to 154,300 ft)
47 km (154,300 ft) from 54 to 90 km 90 km
from 100 to 550 km (can extend and overlap with
ionosphere)
from 550 to 10,000 km
above 10,000 km
In the absence of the ISA table, the following hydrostatics equations give the related properties for the given altitude, h, in meters. Pressure decreases with altitude increase, obeying hydrostatic law; however, atmospheric temperature variation with altitude is influenced by natural phenomenon.
Temperature, T, in °K = 288.15 – (0.0065 x h) up to 11,000 m altitude (in the troposphere) and thereafter constant at 216.66°K until it reaches 25,000 m.
Above 25,000 m, use T in °K = 216.66 + (0.0047 x h) up to 47,000 m altitude (in the stratosphere).
101.325 

![]() x (T/288.16)(g/0’°065R)
x (T/288.16)(g/0’°065R)
101.325 x e(gh/RT)
1.225 x (T/288.16)(g/00065R)-1
1.225 x e-(gh/RT)
Kinematic viscosity
v inm2/s = 1.46 x 10 5 x e(gh/RT)
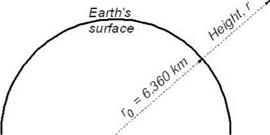
Acceleration due to gravity is inversely proportional to the square of the radius (average radius r0 = 6,360 km) from the center of the Earth. If r is the altitude of an aircraft from the Earth’s surface, then it is at a distance (r0 + r) from the center of the Earth. Figure 3.2 shows schematically the aircraft distance from the center of the Earth.
Then, acceleration due to gravity, g, at height r is expressed as:
where g0 is the acceleration due to gravity at sea level (i. e., surface).
For terrestrial flights, r is much less than r0; there is less than a 1% change in g up to 30 km; hence, g is kept invariant at the sea level value of 9.81 m/s2 for aircraft
Figure 3.2. Aircraft distance from the center of the Earth
 applications. The small error arising from keeping g constant results in geopotential altitude that is slightly lower than the geometric altitude. This book uses the geometric altitude from the ISA table.
As mentioned previously, an aircraft rarely encounters the ISA. Wind circulation over the globe is always occurring. Surface wind current such as doldrums (i. e., slow winds in equatorial regions), trade winds (i. e., predictable wind currents blowing from subtropical to tropical zones), westerlies (i. e., winds blowing in the temperate zone), and polar easterlies (i. e., year-round cold winds blowing in the polar regions) are well known. In addition, there are characteristic winds in typical zones – for example, monsoon storms; wind-tunneling effects of strong winds blowing in valleys and ravines in mountainous and hilly regions; steady up and down drafts at hill slopes; and daily coastal breezes. At higher altitudes, these winds have an effect. Storms, twisters, and cyclones are hazardous winds that must be avoided. There are more complex wind phenomena such as wind-shear, high-altitude jet streams, and vertical gusts. Some of the disturbances are not easily detectable, such as clear air turbulence (CAT). Humidity in the atmosphere is also a factor to be considered. The air-route safety standards have been improved systematically through round-the-clock surveillance and reporting. In addition, modern aircraft are fitted with weather radars to avoid flight paths through disturbed areas. Flight has never been safer apart from manmade hazards. This book addresses only an ISA day, with the exception of gust load, which is addressed in Chapter 5 for structural integrity affecting aircraft weights.
Aircraft design must also consider specific nonstandard conditions. On a hot day, the density of air decreases and aircraft performance degradation will take place as a result of lowered engine power. Certification authorities (i. e., FAA and CAA) require that aircraft demonstrate the ability to perform as predicted in hot and cold weather and in gusty wind. The certification process also includes checks on the ability of the environmental control system (ECS) (e. g., anti-icing/de-icing, and air-conditioning) to cope with extreme temperatures. In this book, performance degradation on a non-ISA day is not addressed. The procedure to address nonstandard atmospheres is identical with the computation using the ISA conditions, except that the atmospheric data are different.


