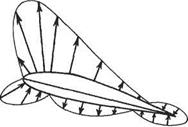
Pressure distribution on an aerofoil
The pressure on the surface of an aerofoil in flight is not uniform. Figure 1.9 shows some typical pressure distributions for a given section at various angles of incidence. It is convenient to deal with non-dimensional pressure differences with p00, the pressure far upstream, being used as the datum. Thus the coefficient of pressure is introduced below
^ (P-Poc)
P~ {PV2
 |
Looking at the sketch for zero incidence (a = 0) it is seen that there are small regions at the nose and tail where Cp is positive but that over most of the section Cp is negative. At the trailing edge the pressure coefficient comes close to +1 but does not actually reach this value. More will be said on this point later. The reduced pressure on the upper surface is tending to draw the section upwards while that on the lower
![]()
![]()
![]()
 where Cps= unity
Direction of arrows indicates positive or negative Cj, s
surface has the opposite effect. With the pressure distribution as sketched, the effect on the upper surface is the larger, and there is a resultant upwards force on the section, that is the lift.
As incidence is increased from zero the following points are noted:
(i) the pressure reduction on the upper surface increases both in intensity and extent until, at large incidence, it actually encroaches on a small part of the front lower surface;
(ii) the stagnation point moves progressively further back on the lower surface, and the increased pressure on the lower surface covers a greater proportion of the surface. The pressure reduction on the lower surface is simultaneously decreased in both intensity and extent.
The large negative values of Cp reached on the upper surface at high incidences, e. g. 15 degrees, are also noteworthy. In some cases values of —6 or —7 are found. This corresponds to local flow speeds of nearly three times the speed of the undisturbed stream.
From the foregoing, the following conclusions may be drawn:
(i) at low incidence the lift is generated by the difference between the pressure reductions on the upper and lower surfaces;
(ii) at higher incidences the lift is partly due to pressure reduction on the upper surface and partly due to pressure increase on the lower surface.
At angles of incidence around 18° or 20° the pressure reduction on the upper surface suddenly collapses and what little lift remains is due principally to the pressure increase on the lower surface. A picture drawn for one small negative incidence (for this aerofoil section, about —4°) would show equal suction effects on the upper and lower surfaces, and the section would give no lift. At more negative incidences the lift would be negative.
The relationship between the pressure distribution and the drag of an aerofoil section is discussed later (Section 1.5.5).


