Rotor Solidity and Blade Loading Coefficient
It will be seen from Eq. 2.46 that the solidity, a, appears in the expression for figure of merit, FM. For a rotor with rectangular blades, the solidity represents the ratio of the lifting area of the blades to the area of the rotor, that is,
blade area Ab NbcR NbC 2 61)
disk area А к R2 ж R
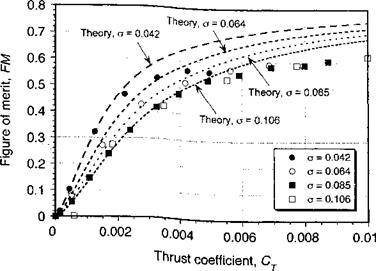
If FM is plotted for rotors with different values of a, the behavior is typified by Fig. 2.13. The data have been taken from the classic experiments of Knight & Hefner (1937), for which the thrust and power were measured for rotors with different numbers of blades. While the number of blades also affects rotor performance (see Section 3.3.10) there are no experiments that have examined solidity effects independently of blade number. Results predicted by means of the modified momentum theory are also shown in Fig. 2.13. From the measurements at zero thrust it was deduced that = 0.011, and к was estimated to be 1.25 and independent of the number of blades. While this value of к is perhaps on the high side for a modem helicopter rotor, it must be recognized that these measurements were made with untwisted blades and so, as will be shown in Chapter 3, this will produce higher induced flow near the tip and, therefore, the rotor is less efficient with a higher value of к.
From the results shown in Fig. 2.13 it will be noted that higher values of FM are obtained with the lowest possible solidity at the same design Cj (i. e., same aircraft gross weight or disk loading). This is hardly an unexpected result from Eq. 2.46 (all other terms such as к being assumed constant) and simply means that the viscous drag on the rotor is being minimized by reducing the net blade area. However, the minimization of rotor solidity, o, must be done with extreme caution. This is because reducing blade area must always result in a higher AoA of the blade sections (and higher lift coefficients) to obtain the same values of Cj and disk loading. Therefore, the lowest allowable value of a must ultimately be limited by the onset of blade stall. This effect is well shown by the results in Fig. 2.13 for the lowest solidity of 0.042, where a progressive departure occurs from the theoretical predictions for Cj > 0.004. For a full-scale rotor this would occur at higher values of Cj because of the higher values of maximum lift found at the higher Reynolds numbers on the blades – see Section 7.9.
An alternative format that emphasizes the local lift loading on the blades is to plot the figure of merit versus blade-loading coefficient, Cj/o. Notice that the blade-loading coefficient can be written as
![]() Cj T / A T
Cj T / A T
a ~ pA(Q, R2) Аь) ~ pAb(QR)2 ’
2 / Fundamentals of Rotor Aerodynamics
|
Figure 2.13 Measured and predicted figure of merit versus thrust coefficient for a hovering rotor with different values of solidity. Data source: Knight & Hefner (1937). |
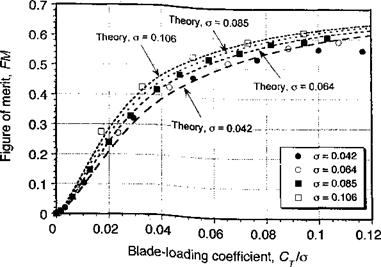
where A* is the area of the blades. These results are shown in Fig. 2.14. Notice that reducing the value of a results in higher values of CT/a for the same operational value of 7. t oug. tg. .14 shows the rotor operates at higher values of FM with increased blade loading coefficient, the maximum value is limited by the occurrence of local flow separation on the blades and finally by blade stall. Typically, for a contemporary helicopter rotor, the maximum realizable value of blade loading coefficient without stall is about 0.12-0.14, but the influence of Reynolds number on blade stall must also be considered, especially with subscale rotors, which includes the measured data presented here.
|
Figure 2.14 Measured and predicted figure of merit versus blade-loading coefficient for a hovering rotor with different solidities. Data source: Knight & Heftier (1937). |
The maximum attainable value of Cj jo will also depend on the distribution of local lift coefficients along the blade, which in turn depends on both the blade twist and the planform. As will be shown in Chapter 3, the local lift coefficients can be related to the blade loading by means of the blade element theory and so the blade twist and blade planform can be designed to delay the effects of stall to higher values of Cjjo. Nevertheless, it is clear that to maximize the figure of merit the blade sections must always operate close to their maximum lift coefficients (i. e., at the highest possible blade loading without the occurrence of blade stall). It can also be concluded that a rotor that uses airfoils with higher values of maximum-lift coefficient can be designed to have lower solidity. This has the benefits of a lower blade and hub weight, both of which are significant contributors to total helicopter weight. Consequently, there is considerable research emphasis in the helicopter industry to design airfoils with high values of maximum-lift coefficient (see Chapter 7).
Yet another form of presentation that emphasizes solidity effects is shown in Fig. 2.15. It is apparent that the figure of merit can be written in the alternative form
3/2
3 /2
 |
In this case plotting FM versus CT /о causes the results for all rotors to coalesce essentially into a single performance curve. These results quickly confirm that the performance of a rotor is independent of the number of blades, but only if the performance is compared at the same value of solidity. While this is not strictly true because of secondary influences such as tip-loss effects and Reynolds number influences on Q0 (Nj, affects blade chord for a given value of solidity), the results shown in Fig. 2.15 are sufficiently convincing.


