TC 217
The adaptation sensor based on an adjoint error estimate is also applied to the second test case of the TC 217 high-lift configuration. The model was a wing/body configuration with deployed slat and flaps. The geometry was previously used in the EUROLIFT project. The flow parameters are Ma « 0.18, Re « 1.5 • 107 and Tref « 114°K. All computations are performed with the Spalart-Allmaras turbulence model.
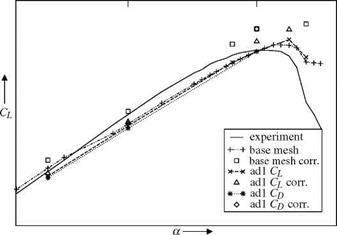
For this configuration the polar was computed on a mesh with NP = 10733766 grid points. Outgoing from this mesh for several angles of attack an adaptation with the new sensor (4) was performed. Like for the DLR-F6 model the adaptation was repeated several times. The number of points increases within each adaptation step by 30%. In contrast to the DLR-F6 test case convergence problems occur on this configuration, e. g. the convergence was too slow and the computational effort too high or the adjoint computation diverges. However, for most of the angles of attack one adaptation iteration was successfully performed. In figure 6 the results of this first test were plotted. The + shows the result of the computation on the base mesh. The corresponding experimental values were plotted as solid line. The major differences are observable in the linear region and near the maximal value of lift CLmax.
|
ai a2
Fig. 6 Lift Cl as function of the angle of attack a for the TC-217 model. + and о denote the results on the base mesh and the corrected values by the adjoint error estimation, respectively. x and * mark the results of the first adaptation step with a sensor based on lift and drag, respectively. The Д and 0 are the corrected values. The solid line denotes the experimental results. |
For lower angles of attack the computational results have a step-like shape. On the other side of the curve the angle of attack and the corresponding lift is too high. The values of the lift corrected by the adjoint error estimate (□ in figure 6) are higher then the original ones.
Outgoing from these results the mesh was adapted for several angles of attack a with the adjoint error estimate for lift (x in figure 6) and drag (* in figure 6), respectively. For both sensors an improvement of the linear region is observable. The step like behaviour vanishes. In the nonlinear region the results (if they are available) are similar to the results on the base mesh. The corrected values for the adapted grids are higher than the original values. Unfortunately most of the adjoint computations fail. Due to this experiment and the high computational effort four adapted meshes are selected from the linear and the nonlinear region. The four selected meshes are the meshes adapted by the lift or drag sensor for a = a1 and a = a2 (see figure 6), respectively. The results are plotted in figure 7. The results on the base mesh are marked by +. The results of the lift adapted mesh at a1 and a2 are denoted by о and □, respectively. The results of the drag adapted meshes are denoted by Д and x.
In figure 7(a) the lift is plotted as function of the angle of attack. In the linear region the values on the adapted meshes are close together. The deviation between the meshes ad1 CL, a1 and ad1 CDa1 is SCl « 1LC. The offset between the meshes ad1 Cl, a2 and ad1 Cd, a2 is of the same order. The offset between the adapted meshes and the base mesh is about SCl « 10LC for a < a1. The step like behaviour in the lift curve at a « a1 vanishes due to the adaptation. In the nonlinear region close to maximal lift the results of the adapted meshes diverge from each other. The results on the meshes which are adapted at a2 show a higher maximal lift coefficient (8Cl ~ 3LC with respect to the base mesh) and also the angle of attack of maximal lift is shifted by 8a « 1° relative to the results on the base mesh. The maximal lift value on the meshes adapted in the linear region at a1 have a lower value than the lift on the base mesh. The offset in the position of the maximal lift is 8a « 0.5°.
In figure 7(b) the lift is plotted as function of the drag. Again the results on the adapted meshes are close together in the linear region. At maximum lift the results on the meshes adapted at ai diverge from the values of the meshes adapted at a2.
All computations differ from the experimental results. The slope of CL(a) is lower for the computational results than in the experiment. The values of maximal lift are higher than in the experiment. The same holds for Cl (Cd ) in figure 7(b). However, in the linear range an improvement by the new method is observable due to the vanishing of the step like behaviour in the linear region. The improvements for the maximal lift are ambiguous.


