Flow induced instabilities in pipe systems with closed side branches
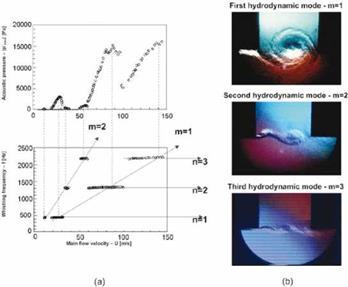
As explained in section 6.5, closed side branches are almost perfect reflectors at frequencies such that the length corresponds to an odd number of quarter wave-length. Early quantitative research on the self-sustained oscillation of this type of closed side-branch resonators has been carried out by Bruggeman et al. (1991) and Ziada and Biihlmann (1992). A literature review on this subject is provided by Tonon et al. (2011). The simplest configuration is a set of two side branches of equal length L and diameter D placed opposite each other, forming a cross with the main pipe of diameter Dp. Figure 22a shows the amplitude of pressure fluctuations p’ measured at the closed side-branch termination as a function of the average flow velocity U along the main pipe. It also shows the corresponding frequency f. With increasing flow velocity U we observe successively the
|
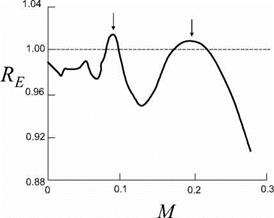
Figure 21. Measurement of energy reflection coefficient RE demonstrating the whistling of a diffuser [Van Lier et al. (2001)]. Arrows indicate acoustic energy production. |
first three acoustic modes of the system with: HeL = fL/c0 « || and |. For each of these acoustic modes we observe two critical Strouhal numbers (two hydrodynamic modes)for optimal whistling: SrD = fD/U « 0.5 and 1.0. They correspond to a travel time of the vortices across the opening of the side-branches of one period and two periods respectively.
Figure 22b shows flow visualization for these two hydrodynamic modes. In this case, the acoustic velocity is mainly normal to the convection velocity of the vortices. If the edges of the T-junctions between the main pipe and the side-branches are rounded, the acoustic velocity amplitude is, in first approximation, spatially uniform over the path of the vortices. The increase in circulation of the vortex during the first oscillation period, whilst traveling from the upstream edge towards the downstream edge explains the net sound production in the system.
It should be noted that for the prediction of the oscillation amplitude we consider self-sustained oscillations. The instability of the shear layer acts
|
Figure 22. Whistling of a cross configuration with two opposite closed side-branches [Kriesels et al. (1995)]. Figure a: Amplitude of pressure pulsations and whistling frequency. The hydrodynamic modes m =1 and m = 2 correspond to Sr = fD/U = 0.5 and 1.0, respectively. Figure b: Flow visualization of the first three hydrodynamic modes in a cross junction (pictures Olivier Schneider and Bram Wijnands). The main pipe is horizontal. The flow is from left to right. |
as an amplifier in this feedback loop, transferring energy from the main flow to the acoustic field. The acoustic resonator selects oscillations close to the resonance frequency. It is a filter. The acoustic oscillation induces new vorticity perturbations at the upstream edge, where the flow separates from the wall. If all these elements in the feedback loop were linear the system would be either stable, neutrally stable or unstable. In stable conditions perturbations decay exponentionally to zero. In unstable conditions the amplitude increases indefinitely. In neutrally stable conditions, the amplitude is the amplitude imposed at the initial conditions, and can have any value. We cannot predict a stable limit cycle oscillation with finite amplitude on the basis of linear theory [Bruggeman et al. (1991), Tonon et al. (2011)]. The non-linear phenomenon which limits the pulsation amplitude depends on the amplitude of the oscillations. For moderate pulsation amplitudes (u’/U = p’/p0c0U < 0.1), the main non-linearity is the saturation of the shear layer amplification due to the concentration of the vorticity into discrete vortices. Once the shear layer has rolled-up to form a discrete vortex we have reached a maximum perturbation. Actually, because the amount of vorticity shed is almost independent of the amplitude dT /dt к – UUc and the path of the vortex almost straight (from the upstream edge to the downstream edge), the product p0(w x v) is mainly determined by the mean flow. It scales with p0U2. The power generated by this source is at a fixed Strouhal number proportional to the acoustic amplitude u’/U. The losses due to friction and radiation are proportional to the square of the amplitude W2/U2. A finite amplitude is found by balancing the power generated by the source and the power related to friction and radiation losses [Tonon et al. (2011)]. When u’/U > 1 vortex shedding and path become dependent on the amplitude. Furthermore, additional vortex shedding from the downstream edge of the T-junction induces additional losses which are scaling with (u’/U)3. As a consequence u’/U = 0(1) is a kind of maximum of the pulsation amplitude which is reached when friction and radiation losses are negligible.
The exact value of the maximum pulsation amplitude depends on the details of geometry. For a cross configuration with rounded edges one can reach u’/U ~ 2 [Slaton and Zeegers (2005)]. At such large pulsation amplitudes shock waves are formed in the side branches due to non-linear wave steepening. For sharp edges one finds u’/U < 0.8 [Kriesels et al. (1995)]. In a Helmholtz resonator under grazing flow with rounded edges one finds u’/U < 0.6 [Dequand et al. (2003a)]. In flue instruments such as a recorder flute or a flute one typically finds u’/U < 0.3 [Verge et al. (1997), Dequand et al. (2003b)].
An interesting aspect of this discussion is that in contrast to turbulence noise produced by flows in free field conditions, the acoustic flow due to whistling is not a small perturbation of the flow. This implies that numerical simulation of the flow is not impossible. In following section an example of such a successful numerical simulation is given.


