FREQUENCY RESPONSE OF FIRST-ORDER SYSTEM
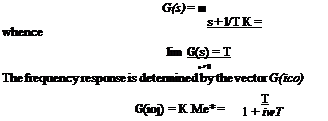
The first-order transfer function, written in terms of the time constant T
 |
|
|
|
|
|
|
|

84 Dynamics о/ atmospheric flight whence
From (3.4,29), M and cp are found to be
![]()
![]() 1
1
(1 + a? T*fA
— cp = tan-1 cqT
A vector plot of Meiv is shown in Fig. 3.13. This kind of diagram is sometimes called the transfer-function locus. Plots of M and <p are given in Figs. 3.14a and b. The abscissa is fT or log wT where / = <ы/2я-, the input frequency. This is the only parameter of the equations, and so the curves are applicable to all first-order systems. It should be noted that at to = 0, M = 1 and cp = 0. This is always true because of the definitions of К and G(s)—it can be seen from (3.2,4) that G(0) = K.
FREQUENCY RESPONSE OF A SECOND-ORDER SYSTEM
The transfer function of a second-order system is given in (3.4,11). The frequency-response vector is therefore
![]() Mei<p — ————- ^————–
Mei<p — ————- ^————–
(<ми2 — со2) + 2i£conco
From the modulus and argument of (3.4,31), we find that
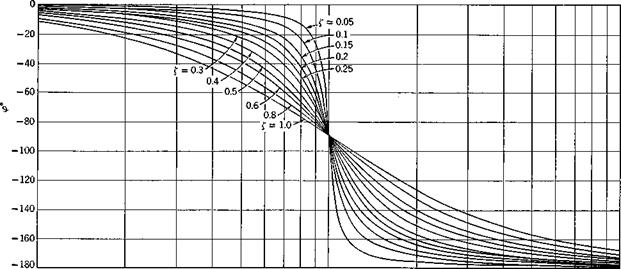
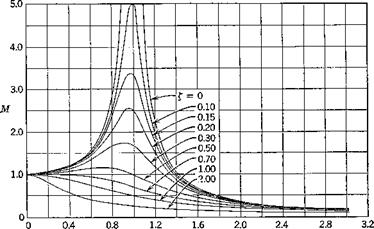
A representative vector plot of Me*9, for damping ratio £ == 0.4, is shown in Fig. 3.15, and families of M and cp are shown in Figs. 3.16 and 3.17. Whereas a single pair of curves serves to define the frequency response of all first – order systems (Fig. 3.14), it takes two families of curves, with the damping ratio as parameter, to display the characteristics of all second-order systems. The importance of the damping as a parameter should be noted. It is especially powerful in controlling the magnitude of the resonance peak which occurs near unity frequency ratio. At this frequency the phase lag is by contrast independent of £, as all the curves pass through cp = —90° there. For all values of £, M -> 1 and cp —> 0 as ojjojn —► 0. This shows that, whenever a system is driven by an oscillatory input whose frequency is low compared to
|
Fig. 3.15 Vector plot of Mei(f> for second-order system. Damping ratio £ = 0.4. |
|
Fig. 3.16 Frequency-response curves—second-order system. |
|
0.1 0.2 0.3 0.4 0.5 0.6 0.8 1.0 2 3 4 5 6 8 10 0)/0!п (а) |

Fig. 3.17 Frequency-response curves—second-order system.
|
the undamped natural frequency, the response will he quasistalic. That is, at each instant, the output will be the same as though the instantaneous value of the input were applied statically.
The behavior of the output when £ is near 0.7 is interesting. For this value of £, it is seen that <p is very nearly linear with o)jo>n up to 1.0. Now the phase lag can be interpreted as a time lag, r = (<р/2тт)Т = (p/a> where T is the period. The output wave form will have its peaks retarded by т sec relative to the input. For the value of £ under consideration, q>l(cojwn) == 7t/2 or g>/ei> = 7г/2соп = Tn, where Tn = 27г/соп, the undamped natural period. Hence we find that, for £ = 7, there is a nearly constant time lag т == Tn, independent of the input frequency, for frequencies below resonance.
The “chain” concept of higher-order systems is especially helpful in relation to frequency response. It is evident that the phase changes through the individual elements are simply additive, so that higher-order systems tend to be characterized by greater phase lags than low-order ones. Also the individual amplitude ratios of the elements are multiplied to form the overall ratio. More explicitly, let
G(s) == G^s) • G2(s) • • • Gn(s) be the overall transfer function of n elements. Then G(ico) — Gflico) ■ G2(ico) ■ • ■ GJico)
= • KM., ■ • • KnMn)e*9
= KMM
so that KM = XT KrMr (a)
![]() r=1
r=1
<p = 2 Vr (b)
r=l
On logarithmic plots (Bode diagrams) we note that
log KM = 2 log KTMr (3.4,34)
r=1
Thus the log of the overall gain is obtained as a sum of the logs of the component gains, and this fact, together with the companion result for phase angle (3.4,33) greatly facilitates graphical methods of analysis and system design.
RELATION BETWEEN IMPULSE RESPONSE AND FREQUENCY RESPONSE
We saw earlier (3.4,7), that h(t) is the inverse Fourier transform of G(ia>), which we can now identify as the frequency response vector. The reciprocal
Fourier transform relation then gives
G(ico) = {Xh(t)e-i0>tdt (3.4,35)
J—00
i. e. the frequency response and impulsive admittance are a Fourier transform pair.
An alternative to (3.4,7) that involves the integration of a real variable over only positive со can be derived from the properties of h(t) and G(im). Since со is always preceded by the factor і in G(im), it follows that G*(im) — G(—im) where ( )* denotes the complex conjugate. Hence
1 Г® If00
h(t) = — eiatG(im) dm = — I [eiatG(im) + e-iatG*(ko)] dm 277 f—oo 277 Jo
= f^M{m)e^ + е~ішіЖ(о7)е-^<и)| dm
= — Г М{еіШ+ч>) + e"<(m<+*>} dm 277 Jo
К f°°
— — M cos (mt + cp) dm 77 Jo
If” К f00 . .
= — M cos mt cos cp dm———- M sin mt sin cp dm (3.4,36)
77 Jo 77 Jo
Since h(t) = 0 for t < 0, then the second term on the r. h.s. of (3.4,36) is equal to the first term for t < 0. But the second term is an odd function of t whereas the first is even. Hence the two terms are equal and opposite for t < 0 and equal for t > 0. Thus
2 C00
h(t) = — К l M(m) cos q>(m) • cos mt dm (3.4,37)
77 Jo
which is the desired result.


