Skin friction and boundary layer
Another consideration is that as we decrease the form drag the skin friction becomes of comparatively greater importance.
2. Skin Friction. Air is slowed up, and brought to a standstill, very close to a surface. If there is dust on an aeroplane wing before flight, it is usually still there after flight. The layers of air near the surface retard the layers farther away – owing to the friction between them, i. e. the viscosity – and so there is a gradual increase in velocity as the distance from the surface increases (Fig. 2.10). The distance above the plate in which the velocity regains a value close to that of the free stream may be no more than a few millimetres over a wing.
The layer or layers of air in which the shearing action takes place, that is to say between the surface and the full velocity of the airflow, is called the boundary layer. Owing to the great importance of skin friction, and necessity of keeping it within reasonable limits, particularly at high speed, much patient research work has been devoted to the study of the boundary layer.
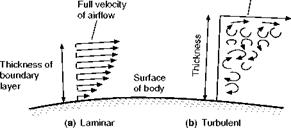
Now the boundary layer, like the main airflow, may be either laminar or turbulent (Figs 2.11 and 2C), and the difference that these two types of flow make to the total skin friction is of the same order as the effect of streamlining
This layer slowed. цр^эу layer below
This layer slowed Tip by layer below Airflow slov^cTup by surface
Airflow slowedjjp by surface_______
This layer sloWedjjp by layer above
This layerslowed_uoby layer above
 Skin friction
|
|
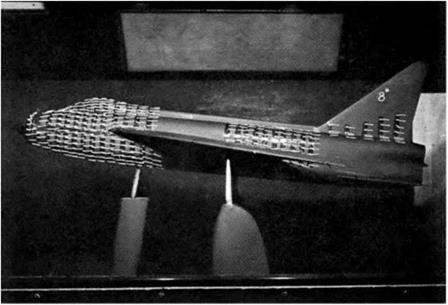
Fig 2C Investigating the boundary layer
(By courtesy of the former British Aircraft Corporation, Preston)
Wool tufts on model of a fuselage the main flow. It has been stated that if we could ensure a laminar boundary layer over the whole surface of a wing the skin friction would be reduced to about one-tenth of its value.
The turbulent layer is characterised by high frequency eddies superimposed on the average velocity at each distance from the surface, while in the laminar case the ‘layers’ of air flow smoothly over each other. The turbulent layer, other factors being equal, has a much higher degree of shear at the surface, and it is this which causes the skin friction to be much higher than it is for the
|
Full velocity of airflow
Fig. 2.11 Laminar and turbulent boundary layer Thickness of layer greatly exaggerated |
 |
Fig 2.12 Transition point
laminar boundary layer. A smooth surface encourages a laminar layer, although other factors such as viscosity and the flow speed are also important. A smooth surface is also important when the boundary layer is turbulent as in this case the skin friction is reduced by a high degree of surface finish, although it remains considerably above the laminar value.
The usual tendency is for the boundary layer to start by being laminar near the leading edge of a body, but there comes a point, called the transition point, when the layer tends to become turbulent and thicker (Fig. 2.12). As the speed increases the transition point tends to move further forward, so more of the boundary layer is turbulent and the skin friction greater.
If this much is understood it will be obvious that the purpose of much research work has been to discover how the transition point moves forward, and how its movement can be controlled so as to maintain laminar flow over as much of the surface as possible.
But a further complication is that the behaviour of the boundary layer is very dependent on the size of an aerofoil (scale affect); this affects its relative thickness, whether it is laminar or turbulent, and how soon it separates from the surface. This is very important in wind tunnel testing which is discussed later. First let us look at how we can represent the drag produced by skin friction and separation.
Drag coefficient
Experiments show that, within certain limitations, it is true to say that the total resistance of a body passing through the air is dependent on the following factors –
(a) The shape of the body.
(b) The frontal area of the body.
(c) The square of the velocity.
(d) The density of the air.
Of these the velocity squared law is not strictly true at any speed and is definitely untrue at very low and very high speeds: when the speeds are low,
matters are complicated by the way in which the boundary layer develops and, at high speeds, by the fact that the air may be compressed.
It is sometimes thought that the air is compressed in front of a body that is moving quite slowly through the air. We know that air is compressible but this does not come into play at speeds well below the speed of sound; at such speeds air behaves very like an almost incompressible liquid such as water. The passage of sound is, of course, caused by compression in the air, and it is only when speeds are reached in the neighbourhood of the speed of sound, about 340 m/s (661 knots), that appreciable compression of the air begins to take place. High-speed aircraft fly in this region, and beyond it. It is also interesting to note that the speed at which sound travels depends on the temperature of the air and becomes appreciably less at high altitudes, and thus the problem of reaching this critical velocity has become an important consideration in high – altitude flying. In such conditions there may be considerable departure from the velocity squared law, but for the low subsonic speeds – say, from 15 to 150 m/s – this law can be taken as accurate enough for practical purposes, so that double the speed means four times the resistance. As regards frontal area, when we are considering bodies of very different dimensions we must remember the scale effect to which we have already referred; we should also notice that, if we have a one-fifth scale model of a body, the frontal area of the full-sized body will be twenty-five times that of the model.
The term ‘frontal area’ means the maximum projected area when viewed in the direction of normal motion, so the frontal area of an aircraft is the maximum cross-sectional area when viewed from the front. In some instances the surface area would be a more sensible area to take – no general rule can be laid down, and the student should remember that the chief object of experiments on resistance is to compare the resistance of bodies of a similar kind. We are not very much concerned with how the resistance of a wing compares with the resistance of a wheel, but we do wish to compare the resistance of wings of different sizes and shapes, and also the resistances of different types of wheels. Therefore, if we choose one method to measure the area of wings and another to measure the area of wheels (as indeed we do), it does not matter very much. We must, however, agree on which reference area we are using in a particular case if we are to compare results sensibly. It is all a question of convenience. We shall return to this when we look at the lift, drag and pitching moments of an aerofoil in the next chapter.
The law of the variation of the resistance with the density of the air is found to be very nearly correct at ordinary densities, and on first thoughts points to the advantages of flight at high altitudes.
Assuming (a), (b), (c) and (d) to be true, we can express the result by the following formula for bodies of the same shape –
R a pV2SF
pV2 looks suspiciously like the dynamic pressure, jpV2, and it is, perhaps, not surprising that the force generated by the air stream depends on this quantity.
The general formula for air resistance, or drag, can thus be written as –
R = cDPv%
where CD is a coefficient (known as the drag coefficient), which depends on the shape of the body and is found by experiment; p represents the density of the air, SF the frontal area of the body, and У the velocity.
The units in this formula will correspond to those adopted in Chapter 1, i. e. the resistance (R) will be in newtons, the density (p) in kilograms per cubic metre, the area (SF) in square metres, velocity (V) in metres per second and the drag coefficient (CD) merely a number.
From this formula we can estimate the resistance of bodies moving through the air, provided we know the value of CD for the particular shape concerned. This is usually found by experiment and, in the absence of more accurate information, the following values may be used –
for a flat plate CD = 1.2 (normal to the flow direction)
for a circular tube CD = 0.6 (axis normal to the flow direction)
for a streamline strut CD = 0.06
EXAMPLE 10.1
Find the resistance of a flat plate, 15 cm by 10 cm, placed at right angles to an airflow of velocity 90 km/h. (Assume sea-level air density of 1.225 kg/m3.)
SOLUTION
Data: CD = 1.2
p = 1.225 kg/m3
V = 90 km/h = 25m/s
SF = 15 x 10 = 150cm2 = 0.015m2
Resistance = CD іpV2SF = 1.2 X 0.5 X 1.225 X 25 X 25 X 0.015 = 6.89 N
Although we have so far applied this formula to resistance only, it is really of far wider application; it can, in fact, be used to represent any force and, with a small modification, moment, produced by the flow of air and the reader will be well advised to be sure that he understands just what it means. Therefore, let us sum up the position by saying that the aerodynamic drag experienced by any body depends on the shape of the body (represented by the coefficient CD in the formula), the dynamic pressure of the air when it is of the given density and flowing at the given velocity (represented by IpV2), and the size of the body, in this case given by the frontal area (represented by SF).
We can base our coefficient on areas other than SF, if this is more convenient; this we shall do in the next chapter, when we look at the forces and moments produced by an aerofoil. If we change the reference area, though, CD will have to be correspondingly changed to keep the total resistance at the correct value; so we must agree on which reference area we are using in each case.


