Case Study: High Pressure Turbine Rotor
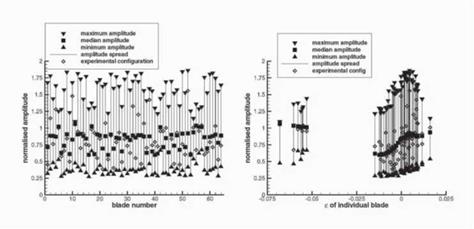
In the experimental set-up, only a single arrangement of the blades with their given individual mistuning on the rotor circumference could be studied. From these experiments alone, it is thus not possible to differentiate between the in – flience of individual blade mistuning and the inflience of blade arrangement on the rotor. It remains unclear, whether the specific experimental configuration represents a typical case or – by mere chance – is a rare one with extraordinary high or low amplitudes. Furthermore, from the single configuration studied experimentally, it cannot be shown conclusively whether some correlation between resonant amplitude and mistuning strength exists. To acquire more information on these topics, a further analytical study was performed. Here, 1500 cases were studied, where for each of these, the blades were randomly rearranged on the rotor. Each configuration was then analyzed using the same procedure as described above for the experimental configuration. In Fig. 4, the resulting amplitude values are displayed. Here, the individual maximum blade amplitudes are shown as an interval, where the maximum and minimum for each blade have been marked with the solid gradient and delta symbols, respectively. Note that the blade numbers given here refer to the blades themselves, not to the blade position on the rotor. Each blade number hence corresponds to a single mistuning strength є. Further symbols shown in the figure are the solid squares, denoting the median of blade amplitudes for each blade, and the open diamonds, showing the computational results for the experimental configuration, as in Fig. 2. The figure shows that the blade relative positioning
|
Figure 4. ADTurB rotor 1T / 43rd EO Figure 5. As Fig. 4, but plotted over mis- blade amplitudes of each blade over blade tuning parameter e number for 1500 configurations of random rearrangement |
around the rotor circumference has a large infhence on the response amplitudes. For some blades, the maximum and minimum amplitudes are more than a factor of 5 apart. The median values, representing the highest probability of the amplitudes, however, are restricted to a much smaller band, ranging from normalized amplitude values of approximately 0.6 to 1.1. The values taken from the experimental configuration blend into the range given, covering most of the amplitude region. Furthermore, the distribution of the median values close to normalized amplitudes of one indicates that the average of the experimentally observed amplitudes, which was taken as the reference value, is very representative of a typical configuration. Arranging the same data points over the individual blade mistuning parameter є results in the graph shown in Fig. 5. Here a certain dependence of the minimum, maximum and median amplitude values on the blade mistuning is apparent. Obviously, the spread of minimum and maximum amplitudes is highest for small positive values of є, while it is lower for large negative or positive є. The median amplitudes are highest for the blades with large negative mistuning, then drop to significantly lower amplitudes for small negative values of є and rise again sharply with small positive є. However, the relative positioning of the blades has a much larger inflience on the amplitudes than the individual mistuning strength.


