Forced response analysis
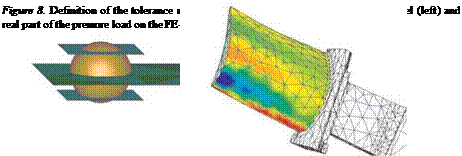
In the FE response analysis, the real and imaginary pressure results acting on each contour node are used as excitation loads for the 1st torsional mode of the blade vibrating with the 21st nodal diameter [11].
F(reai, biade) = Pk, x[cos(kas – вк, х) + jsin(kas – вк, х)] F(img, bia, de) = Pk, x[sin(kas – вк, х) – jcos(kas – вк, х)]
where j = v — I and x refers either to the circumferential or to the axial direction, ад, is the circumferential position of node 5, and /3 denotes the phase
delay (Pfc = /(P|,;m + РІгеа1У, 13 = arctan(Pk4m/Pk, reoi ))•
Since the resonance is at the 43rd engine order, the frequency shift due to the scaling of the CFD model is corrected implicitly. The CFD results are read across from the steady calculation at the speed, close to the resonance speed, of the steady state rig tests.
The resonance steady-state response of the rotor blade is computed by using a commercial general purpose FE-solver that solves
![]()
 |
iQi, n + 2Ui, nZ – iq_i, n + kinQi, n = ML{Pk}ej( kas в)ej( кШ)
where к = 1, 2,то the Fourier mode of the excitation, i = 1, 2, 3 indicates the number of the mode shape and as denotes the circumferential position of the excited node of the cyclic FE model [11]. min = {ф}Тп [M (п)]{Ф}і, п and
kin = {ф}Тп [K(ш, п)]{Ф}і n are the modal mass and stiffness of the cyclic FE model, respectively. {Ф}Тп is the conjugate transposed vector of the disc
eigenform {Ф}і, n.
From calibration bench tests with a rigidly clamped blade root, a damping of 0.17% was obtained. In the real disk assembly, the blades are not per
fectly clamped and the disk contributes to the overall damping. Consequently, a damping value of 0.3% was used for the forced response calculations, in line with [10]. Using w = ui(1 — £2)1/2, a damping ratio of 0.3% will give a resonance frequency that is virtually identical to the natural frequency of 4798.10 Hz determined in the free vibration analysis.
The resonance amplitudes and the von Mises stresses are shown in Fig. 9. The maximum response occurs at the tip trailing edge, and the maximum von Mises stress occurs at the shank of the blade.
Figure 10 shows the calculated tip amplitudes compared to the test results. The amplitudes are normalized with respect to the averaged blade displacement from the mistuned disk, and the range of individual blade responses is indicated by the vertical line. The line on the averaged experimental displacement value
|
Figure 9. FE results: Displacements (left) and stresses (right) |
indicates the range of amplitudes in the mistuned system.
The agreement between calculation and experiments is good and only small differences are observed between the two cases.


