Our heavyweight helicopter equal in the world does not have
In Rostov started production of the most load-lifting rotary-wing car The Russian holding «Helicopt[...]

Everything about aircrafts and helicopters. News and events in aviation worldwide. Civil, transportation, military helicopters and airplanes.

Everything about aircrafts and helicopters. News and events in aviation worldwide. Civil, transportation, military helicopters and airplanes.

Everything about aircrafts and helicopters. News and events in aviation worldwide. Civil, transportation, military helicopters and airplanes.

Everything about aircrafts and helicopters. News and events in aviation worldwide. Civil, transportation, military helicopters and airplanes.


When studying natural flyers, it is insightful to assess the effects of different parameters, such as wing area and wing span, on the flight characteristics based on the dimensional analysis [4] [29] [52]-[54]; this analysis presents very interesting correlations that can be used to summarize the various scaling laws ranging from birds and insects to aircraft. Tennekes [29] considered the relations between cruising speed, weight, and wing loading and established The Great Flight Diagram. The diagram is shown in Figure 1.19.
|
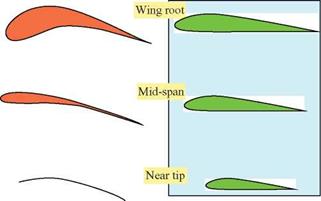
Pigeon wing Conventional airplane wing
Figure 1.18. Comparison of cross-sectional shapes of a pigeon wing and a conventional transport airplane wing. The pigeon wing exhibits noticeably more variations in camber and thickness along the spanwise direction. |
With technical advancement, the MAV dimensions, wing loading, and speed will continue to decrease, moving toward the lower left corner in Figure 1.19. From Figure 1.19 one can compare and correlate relations between species with a pronounced difference in size. For example, the small fruit fly (Drosophila melanogaster) can be compared to the Boeing 747, which weighs about 500 billion times more. By using scaling analysis, one can predict how a parameter, such as wingspan, varies with another parameter, such as the body mass, for natural flyers in general or specific animal groups.
As an illustration, consider the balance between lift (L) and weight (W) during steady-state flight,
1
L = W = 2 pU 2SCl. (1-1)
From Eq. (1-1) it is possible to get an understanding of how wing area (S), air speed (U), density (p), and wing loading (W/S) are connected. Wing area (S): The wing area for a flight vehicle is often defined as the area projected when the wing is seen from above, and usually it includes the contribution from the “wing area” inside the fuselage. Airspeed (U): The air speed is defined as the forward velocity for the flight vehicle. Given a particular AoA, a twofold increase in speed will result in a fourfold increase in lift. Density (p): For cases of interest to bird and insect flight, the density of the air is basically unchanged, because birds fly within a narrow altitude near sea level. In general, a decrease of density due to an increase in altitude will decrease the lift.
From Eq. (1-1), it is clear that the cruising speed depends on the wing loading (W/S):
W1
у = 2 PU 2Cl . (1-2)
Equation (1-2) shows that the greater a flyer’s wing loading, the faster it has to fly. Some of the relations between body mass and parameters connected to birds
|
Table 1.3. Power functions of wing dimensions and flight parameters against body mass m
Source: Originally compiled by Norberg[4], Greenewalt [55], and Rayner [56]. |
are shown in Table 1.3. Figure 1.19 offers a correlation between sizes and speeds, and Table 1.3 summarizes expanded correlations. More details are discussed in the following sections.