Hovering and Axial Climb Performance
It has already been shown in Chapter 3 that the rotor power required in hover can be estimated from the equation
![]()
 |
kW3/2 о /crCdQ ( 1 W3/1
P=Pi + P„ = ^== + pA(QRf ) ^==,
V^/O/i о / PM / у/Ip A
or in nondimensional form simply as
where Cw(~ Cp) is the weight coefficient, к is the induced power factor of the rotor, C^0 is the average profile drag coefficient of the blade sections, and FM is the figure of merit of the rotor.
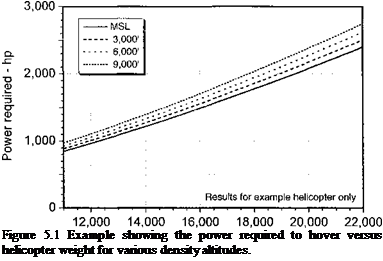
Note from Eq. 5.13 that the hover power required is a function of aircraft gross weight and ambient density. The basic effect of density altitude on hovering performance is illustrated in Fig. 5.1. The results are for a representative helicopter closely resembling the UH-60, for which the basic parameters of this aircraft are given in Table 5.2. The empty weight of
|
Table 5.2. Parameters for Example Helicopter
|
1,500
 D.
D.
sz
Ф
M 1,000
CO
>
(0
0)
5
о
Cl
(о 500
oo
0
16,0 17, the aircraft is 11,000 lb (5,000 kg). Notice from Fig. 5.1 that as much as 20% greater power will be required to hover at a density altitude of 9,000 ft versus that required at sea level conditions. The induced power factor к or figure of merit FM is not substantially affected by density altitude. While the power required to hover increases with increasing density altitude, the engine power available also decreases – see Section 5.5.5. For a reciprocating engine a reasonable approximation can be found by multiplying the power available at mean sea level (MSL) by the density ratio found at that altitude relative to MSL with a nonstandard temperature correction. For a turboshaft engine the power output at altitude follows a more complicated relationship but is approximately proportional to the atmospheric pressure ratio with a nonstandard temperature correction.
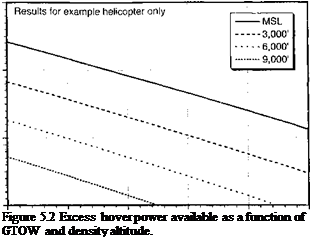
Representative results for the example helicopter that show the decrease in excess power with aircraft gross weight for various density altitudes are given in Fig 5.2. At any given altitude the decrease in excess power is almost proportional to the extra aircraft weight. The excess power available with altitude ultimately becomes zero, and this defines the hover ceiling. For a maximum GTOW of 20,000 lb (9,100 kg) the hover ceiling for the example helicopter is about 7,000 ft (« 2,100 m), which means that the aircraft cannot hover above this altitude at this weight. The helicopter, however, will be able to fly at considerably higher altitudes with some forward speed – see Section 5.5.9.
The power required for any vertical rate of climb, Vc, can be estimated by solving for the induced velocity using the momentum theory result given previously in Chapter 2, namely
Vi V – / / 2 K.
— =———— b J І —— ) + 1 ~ 1——— — for low rates of climb, p. tb)
vh 2vh)j2vhJ 2vh
where vh is the hover induced velocity. The maximum rate of climb is then obtained by solving for Vc using
^h– +1^1 + for low rates of climb, (5.16)
Ph 2 Vhf2vh) 2vh
where ДР is the excess power available over and above that required for hover. Note that the climb velocity does not depend on excess rotor thrust but on an excess of power. It will
be apparent that for low to moderate rates of climb AP ^ TVJ2, or that Vc ~ 2ДР/ W in axial (vertical) flight. Because of increased inflow through the rotor disk, higher values of collective pitch will be required in a climb. Normally it is convention in performance work for the rate of climb to be expressed in terms of feet per minute, mainly because the rate of climb indicator in the aircraft will be calibrated this way. See also Section 6.6.2 for further discussion on climb performance.
Representative results for the maximum possible climb velocity for the example helicopter at a GTOW = 16,000 lb (7,256 kg) are shown in Fig. 5.3. Notice the significant decrease in the maximum possible climb velocity with increasing density altitude. High values of density altitude can be encountered during “hot and high” operations, and it is important for the pilot to recognize that a potentially serious performance degradation may occur under these conditions.


