Lift curve
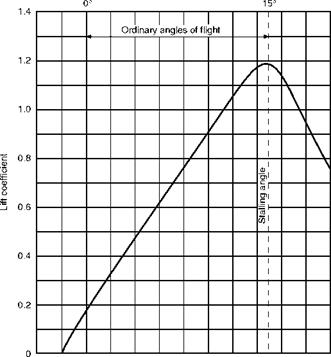
Let us first see how the lift coefficient changes with the angle of attack (Fig. 3.13).
We notice that when the angle of attack has reached 0° there is already a definite lift coefficient and therefore a definite lift; this is a property of most cambered aerofoils. A flat plate, or a symmetrical aerofoil, will of course give no lift when there is no angle of attack.
Then between 0° and about 12° the graph is practically a straight line, meaning that as the angle of attack increases there is a steady increase in the lift; whereas above 12°, although the lift still increases for a few degrees, the increase is now comparatively small and the graph is curving to form a top, or maximum point.
At about 15° the lift coefficient reaches a maximum, and above this angle it begins to decrease, the graph now curving downwards.
|
-4° 0° 4° 8° 12° 16° 20° Angle of attack |
Fig 3.13 Lift curve
Stalling of aerofoil
This last discovery is perhaps the most important factor in the understanding of the why and wherefore of flight. It means that whereas at small angles any increase in the angle at which the aerofoil strikes the air will result in an increase in lift, when a certain angle is reached any further increase of angle will result in a loss of lift.
This angle is called the stalling angle of the aerofoil, and, rather curiously, perhaps, we find that the shape of the aerofoil makes little difference to the angle at which this stalling takes place, although it may affect considerably the amount of lift obtained from the aerofoil at that angle.
Now, what is the cause of this comparatively sudden breakdown of lift? The student will be well advised to take the first available opportunity of watching, or trying for himself, some simple experiment to see what happens. Although, naturally, the best demonstration can be given in wind tunnels with proper apparatus for the purpose, perfectly satisfactory experiments can be made by using paper or wooden model aerofoils and inserting them in any fairly steady flow of air or water, or moving them through air or water. The movement of the fluid is emphasised by introducing wool streamers or smoke in the case of air and coloured streams in the case of water.
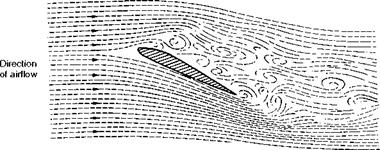
Contrary to what might be expected, the relative speed at which the aerofoil moves through the fluid makes very little difference to the angle at which stalling takes place; in fact, an aerofoil stalls at a certain angle, not at a certain speed. (It is not correct to talk about the stalling speed of an aerofoil, but it will be seen in a later chapter why we talk about the stalling speed of an aeroplane.) Now what happens? While the angle at which the aerofoil strikes the fluid is comparatively small, the fluid is deflected by the aerofoil, and the flow is of a steady nature (compare Fig. 3.4); but suddenly, when the critical angle of about 15° is reached, there is a complete change in the nature of the flow. The airflow breaks away or separates from the top surface forming vortices similar to those behind a flat plate placed at right angles to the wind; there is therefore very little lift. Some experiments actually show that the fluid which has flowed beneath the under-surface doubles back round the trailing edge and proceeds to flow forward over the upper surface. In short, the steady flow has broken down and what is called separation or ‘stalling’ has taken its place, with consequent loss in lift (Fig. 3.14).
Anyone who has steered a boat will be familiar with the same kind of phenomenon when the rudder is put too far over, and yachtsmen also experience ‘stalling’ when their sails are set at too large an angle to the relative wind. There are, in fact, many examples of stalling in addition to that of the aerofoil.
What happens is made even more clear if we look again at the results of pressure plotting (Fig. 3.11). We notice that up to the critical angle considerable suction has been built up over the top surface, especially near the leading
|
|
Fig 3.14 Stalling of an aerofoil
edge, whereas when we reach the stalling angle the suction near the leading edge disappears, and this accounts for the loss in lift, because the pressure on other parts of the aerofoil remains much the same as before the critical angle.
Some students are apt to think that all the lift disappears after the critical angle; this is not so, as will easily be seen by reference to either the lift curve or to the pressure plotting diagrams. The aerofoil will, in fact, give some lift up to an angle of attack of 90°. Modern interceptor aircraft are sometimes flown at very high angles of attack during violent manoeuvres, so the upper portion of the graph is nowadays quite important.
The stalling angle, then, is that angle of attack at which the lift coefficient of an aerofoil is a maximum, and beyond which it begins to decrease owing to the airflow becoming separated.


