Measurements and Data Analysis
As documented by Cheatham and Tyner [9], critical blade modes and their natural frequencies were identified by NASTRAN finite element analysis, impact testing, and holography. Stress Pattern Analysis using Thermal Emissions (SPATE) was also employed to identify areas of maximum vibratory stress for modes of interest. Three gauge locations, which offered sufficient sensitivity to the expected critical modes, were selected for vibration monitoring during subsequent rig tests.
Strain gauges were surface mounted on the pressure side of nine rotor blades at each of the three locations, which are depicted in Fig. 5. The strain gauge bridge circuitry was zero balanced and calibrated for 10 ksi (69 MPa) per signal volt. As required to maintain effective resolution of the dynamic signals while avoiding saturation due to high steady loading, the gauges were rebalanced at 80% rotor speed. The strain signals were extracted from the rotor via a slipring. These and other dynamic signals, such as a once-per-revolution key – phaser, were simultaneously recorded with a high-speed 28-channel analog tape recorder.
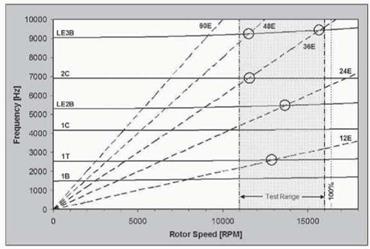
Several resonance crossings were identified from the Campbell diagram, shown in Fig. 5, as being potential HCF drivers for the 12-WG configuration. The fundamental 12E crossing of the first torsional mode (1T/12E) near 12,800 RPM was known to be particularly severe. Harmonic crossings were also of interest, including those of the second leading-edge bending mode (LE2B/24E) near 13,600 RPM and the second chordwise bending mode (2C/36E) near 11,600 RPM. These crossings, as well as a pair of Mode 7 crossings, are indicated by circles in the figure. To encompass these and higher order modal crossings, a test range from 11,000 RPM to 16,000 RPM (67 – 97% of design speed) was selected.
|
Figure 4. SMI fan Campbell diagram showing 12-WG harmonic excitations (dashed), test range (shaded) and resonance crossings (circled) within the test range |
Rotor speed sweeps were conducted for a range of full – and part-span TEB fbwrates. The present discussion includes only the full-span TEB results, which correspond to uniform flow to all 7 holes on each WG, with flowrates ranging from 0.3% to 1.0% of the rig design fbw capacity. For each test case, data was recorded for a 45 second period, during which the rotor speed was gradually increased through the test range.
Rotor forced response data were then digitized and post-processed using an in-house engine-order tracking program. Using the key-phaser to establish the position of the rotor, the original time-sampled data were resampled at fixed rotor angle steps. As such, the resampled data always includes the same number of points per revolution, regardless of rotor speed. Upon subsequent FFT – analysis, spectral lines correspond to fixed engine-orders, or multiples of the shaft rotational frequency. Thus the effective sampling frequency, and hence the frequency associated with each spectral line, is scaled linearly with the rotational frequency. This order analysis approach has the advantage of providing precise amplitude and phase tracking of the response to known engine-order excitations (i. e. the WG wakes), as well as their higher harmonics. A detailed discussion of the computed order tracking technique is provided by Fyfe and Munck [11].


