
Our heavyweight helicopter equal in the world does not have
In Rostov started production of the most load-lifting rotary-wing car The Russian holding «Helicopt[...]

Everything about aircrafts and helicopters. News and events in aviation worldwide. Civil, transportation, military helicopters and airplanes.

Everything about aircrafts and helicopters. News and events in aviation worldwide. Civil, transportation, military helicopters and airplanes.

Everything about aircrafts and helicopters. News and events in aviation worldwide. Civil, transportation, military helicopters and airplanes.

Everything about aircrafts and helicopters. News and events in aviation worldwide. Civil, transportation, military helicopters and airplanes.


Before the airline makes a cost economic comparison it should first evaluate how the aircraft fits in the current fleet in terms of maintainability, passenger comfort, interior arrangement, handling and turnaround lime Reference (37) states that environmental factors such as domestic air policies, expected traffic demand, capacity and frequency, financing and domestic traffic infrastructure also play a role.
It is outside the scope of this section to go into all of these factors but a few are directly related to the aircraft design and should therefore be mentioned
• The cruise speed is an important criterion since it influences the number of flights per day on a given route. Airlines greatly favor even numbers of flights a day since this enables them to perform the aircraft’s (nightly) maintenance in its home port each day. Mach 2 is therefore a good cruise number for the transatlantic range.
• The operational flexibility. Performance in terms of turnaround time, maintenance and takeoff field performance should be as good as the aircraft the new aircraft is compared with, to he able to use this method.
I%7 the Air Transport Association of America [31] published a standard method to estimate tlie direct operating cost of aircraft This method is no longer used to obtain actual direct operating cost, but it is still used to make comparative and parametric studies. Since 1967. the airframe manufacturers have been updating this method to reflect the technological progress. These studies were generally not available to the public However, in 1978 American Airlines and NASA pul out a new study 128] and (33} that reflected the added experience in aircraft operation since 1967.
One of the suggestions in the new meilwd. the introduction of “aircraft related operating expenses” instead of the DOC. was not followed, as far as the author can tell. Since some of the items in the new definition have a large variance for different operations in different nations (e g. fuel servicing fees, training costs), the аиііюг has decided to keep the original definition for the direct operating cost, but to use updated relations from the American Airlines study for the actual equations. The factors in these equations were sealed to represent 1994 European conditions.
To enable us to compare configurations all costs and profits are expressed per scat km PROFIT * REV – (IOC ♦ DOC) (5)
The indirect operating cost IOC will primarily depend on the operator’s type of organization and policy. This cost includes maintenance of buildings, servicing of flight operations and administration and sales. In 1985 the average IOC of the world scheduled airlines was 3.5 Set/ pass km. The direct operating cost DOC include the cost of flying, airplane maintenance and depreciation. Ticket revenue REV depends on the load factor «averaging around 65*5- of the maximum capacity) and the pricing policies of the airline. In 1985 the average revenue per passenger was 5.7Sct/km. today (1995) it is closer to 8$ct/km
In ihc following statistical formulae we have used daia published in the US Department of Transportation in reference (36].
Defining the block-speed:
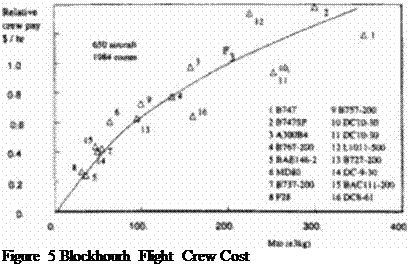
The flight time is calculated during ihe mission integration. The loss time is taken to be 30 minutes. Figure 5 relates the cost of a flight crew, including training and employee benefits, per block hour can be expressed to the aircraft’s maximum takeoff weight.
|
£>/(0.21 * mf h + 0.74 tb nf) — |
There is an estimated additional 80 dollars for international operations and 190 dollars for supersonic flight per flight hour. The current cost of fuel can be used to calculate the fuel cost:
 |
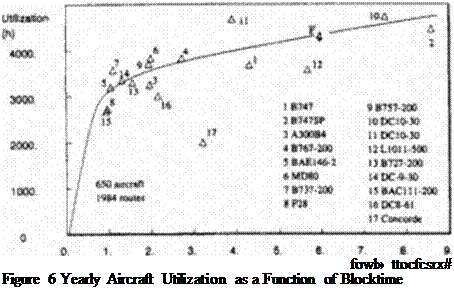
As mentioned in the previous section the block fuel includes non-revenue flying and maneuvers Figure 6 shows that there exists an empirical relation between the the annual utilization of 618 aircraft and the average route block time. In the literature sometimes higher values arc quoted, but in practice values over $000 h arc seldom achieved on average. A year has 8760 hours so that means the aircraft would have to be in the air 60 % of its life (including all inspections).
 |
иш Fa (tb) <9>
We can now calculate the cost of insurance based on an insurance rate і betw een 0 5 and
 |
|
1.0%.
 |
|
The capital cost can he calculated assuming a depreciation to 10% of the original value in period P of 14 years Four percent of the airframe value is needed for spares, while 30% of the engine value is needed for spares’:
In the published data of reference (36) a large discrepancy can be observed between the above depreciation and the value found in our estimate It must be noted that in reference (3b) the depreciation is made on the original purchase price and not the present purchase price We can synchronize both methods by correcting the depreciation of the airframe each >car with the airframe deflator.
Based on the original ATA’67 publication and the data published by the U. S Department of Transportation, a new model for estimating maintenance cost was proposed. The model is correct for aircraft five years after their introduction and four years after purchase The [1]
original formulae in references (28) and (33) have been simplified by reasonable assumptions and variable estimates as presented by the methods in the section on weight prediction1 .
Equation (13) predicts the number of labor hours per airframe per flight cycle. These cost arc associated with the number of passengers (for example: cleaning the scats) and the size of the aircraft
И, РГ, ш <2.14 ♦ 0.0000079 m, + 0.0046 s) ‘Af (12)
А/С to
Equation (13) predicts the number of labor hours per airframe per flight hour. This includes repairs to the flight structure, and the passenger facilities:
//r -(3.08 + 0 000032 m,+ 0.0041 а) Л/ (13)
AN. of
For high subsonic operations die Mach number M is set to 1. According to Air France[2] [3] [4] “twice as much effort" is spent servicing the Concorde for every hour of flight as it does for planes that cannot fly at the speed of sound. However, this is primarily due the small size of the Concorde fleet and the square root relations as proposed by ATA will probably be more accurate for larger supersonic fleets. Airframe labor cost are expressed in equation (14) as a function of the labor hours per flight hour and the labor hours per airframe.
The number of labor hours pci engine per flight hour can now he expressed as:
1452 +0.530 * m
HFL = ———— ———— 4- 0.143 (16)
Д/
r
We can now express the engine labor cost in equation (17)
 |
|
 |
|
Airframe parts costs is again divided into the costs per flight cycle and the costs per flight hour The materials costs per airframe per flight cycle is.
The materials costs per airframe per flight hour
|
Г 0.045 • C/l п’ [2Л D’+—*r] |
The engine parts costs is expressed in equation (21):
In equation (22) the maintenance burden, indirect maintenance costs such as supervision. inventory management are related to the total labor cost:
Cn = HC„.5 + CJ (22)
Since 1967 the overhead burden has gone up twice as fast as labour inflation. As is clear in Figure 7. a large variation in maintenance соки exist*. New aircraft like the B757 and the B767 have much lower maintenance costs than predicted, while some more unusual and older aircraft like the BAEI11 have higher maintenance cost. On average the model will arrive at a 24T than actual maintenance costs because so many new aircraft have much lower costs than aircraft that arc 5 years or older.
|
praJuml |
1985 |
||||
|
900 |
|||||
|
900 |
✓ . " |Л |
||||
|
к >10 yui |
У |
||||
|
TOO |
1 |
||||
|
•X |
– |
« * ‘ |
> |
S |
|
|
900 |
■ |
, * »•» » |
У |
у А» |
|
|
A ✓ |
1»Ш |
• ШУТТ-Ж |
|||
|
40C |
и |
1ГІЧГ |
10 ООО-V) |
||
|
a * „ Г |
к |
пхти |
п ocio-w |
||
|
xo |
4 its |
UUOIIJCO |
|||
|
s |
5вА» 1*4; |
ипня |
|||
|
2W |
s |
«мою |
HOC-*-» |
||
|
У |
ЩТО » |
1) 0*011 >Х |
|||
|
100 |
У У |
ил |
1* DC0-4-I |
||
|
0 |
|||||
|
0 |
too гоо эоо «оо |
900 |
*00 ТОО |
все вес |
Figure 7 Predicted and Actual Aircraft Maintenance Costs
An estimate of «he direct operating cost per seat kilometer can now he obtained:
Tabic 1 shows some published duect operating cost and the costs predicted by this method. A very good correlation is achieved overall
|
type |
year |
seats |
R(km) |
DOC |
DOC-estim. |
|
F-2H-6000 |
1973 |
79 |
1200 |
.61 |
.64 |
|
L-I0I1 |
1970 |
268 |
6800 |
.44 |
46 |
|
Concorde |
1976 |
108 |
6230 |
3.3 |
3.3 |
|
B747-I00 |
1970 |
374 |
6000 |
.42 |
.45 |
|
В 707 |
1970 |
149 |
6000 |
50 |
.55 |
|
Table I Prediction of Historical Direct Operating Costs |
The indirect operating cost can be subdivided into two groups: aircraft related and non – aircraft related operating costs.
The aircraft related operating cost per km are:
Ground handling, equipment and landing fees are roughly proportion») to the maximum lakcoff weight, end inversely proportional to the aircraft range
С «Д0023тм / R (24)
o. lO I to
The navigation fees and the aircrafts administration per kin are proportional to the maximum takeoff weight:
С,, – Д 10.58 ♦ 6.70-7 m ) (25)
0.11 / to
Cabin cress cost per km is proportional to the number of scats and inversely proportional to the cruise speed:
C „•D.42B/V. (26)
0,1it D
The non aircraft related operating cost arc currently around 1.5 cts/s. km assuming a loadfactor I of 100 %. They arc typically one lime expenses per passengers and therefore inversely proportional to range. These costs include: passenger food, passenger service, baggage handling. reservation advertising, commissions and airline non-aircraft administration.
C D. 13 s l /R (27)
o,13 <
IOC = y" ^ 128)
^-r = 10 s
