Validation of STGM
A zero-pressure gradient boundary layer was investigated and compared to reference solutions using two synthetic turbulence methods, based on the controlled forcing approach downstream of the inlet. Four simulations were carried out: a full domain LES (referred to as ’full LES’), a full domain RANS, and two synthetic turbulence – LES simulations with controlled forcing. All four cases were computed with the same flow and numerical configuration, M„ = 0.4, Reg = 10000. The numerical details are given in Tab. 3.
The reference full LES was computed using the rescaling method according to El-Askary et al. [8]. The full domain RANS calculation based on the Spalart – Allmaras model (referred to as ’RANS S-A’) was performed for comparison
![]()
|
|
|
|
|
|
Table 3 Numerical details for the simulation of turbulent boundary layer at Ma = 0.4 and Reg = 10000 for LES and RANS solutions
|
purposes and to provide the target data for the synthetic turbulence inlet and for the control planes. In the zonal simulations the control planes are distributed over a length of one boundary layer thickness So.
Figure 4 (left) compares the evolution of the wall friction coefficient Cf for all four flow cases. The solutions of full LES and full RANS do not differ much regarding the wall shear stress for this simple zero-pressure gradient boundary layer. Thus, the applied rescaling method at this numerical configuration is valid for LES and RANS simulations and poses no difficulty to match them at the beginning of the computational domain. Both, the zonal SEM and the zonal Batten approach, show, despite their fundamental differences in their formulations, a comparable required length until they converge to the full LES solution. The van Driest velocity profiles obtained at x/So = 5 which are presented in Fig. 4 (right) show that both STGM produce the expected asymptotic near-wall behavior of a turbulent flow, but the results differ somewhat at the edge of the boundary layer.
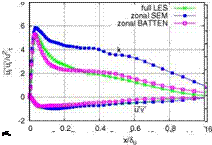
Figure 5 depicts the turbulent kinetic energy k and Reynolds shear stress component (u’v’) at two different locations downstream of the inlet. It is shown that the flow generated by the zonal Batten approach undergoes a slight laminarization process downstream of the interface but the control planes increase the turbulent shear stress budget to the full LES level. The turbulent structures generated by the zonal SEM approach do not dissipate downstream of the inlet but the control planes introduce a local overshoot of the turbulence level which decreases to the full LES turbulence level at around 5 x/SQ. By improving the response of the control planes to the local flow events, the turbulent shear stress level of the full LES could be reached within one boundary layer thickness Sq.
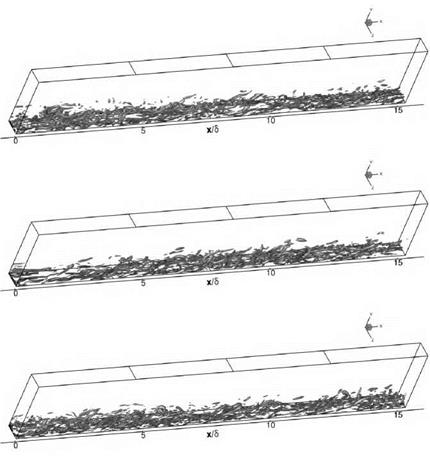
Яг-contours (Jeong et al. [13]) of both zonal cases and the full LES are visualized in Fig. 6. It is shown that the structures which are introduced into the domain by the zonal SEM approach are not dissipating. The structures at the inlet of the case computed with the zonal Batten approach fade away and the control planes downstream of the inlet have to enhance the locally rare events like turbulent bursts and sweeps to reach the turbulence level of the full LES computation.
Due to the low Reynolds number for this case it was expected that the ’artificial’ turbulence would dissipate at the beginning of the domain to develop ’physical’ turbulence further downstream after the transition process at about x/S0 — 10. However, Figs. 4 (left) and 5 (left) show that when the zonal SEM approach is used the Reynolds shear stress (u’v1) does not decrease below the level of the full domain
 |
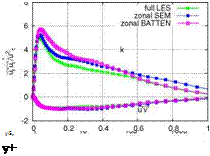 |
Fig. 4 Evolution of skin friction coefficient Cf (left) and van Driest velocity profile (right) for boundary layer flow at Ma = 0.4 and Reg0 = 10000 for different computational configurations
Fig. 5 Turbulent kinetic energy k and Reynolds shear stress {u’v’) at x/ S = 1 (left) and at x/So = 5 (right)
LES but generates an overshoot of turbulent kinetic energy. The zonal Batten approach tends to provide a lower Reynolds shear stress level which is to be increased by the control planes which are located downstream of the inlet. For the following computations the zonal SEM approach is used since the quality of the results is acceptable and it is computationally less expensive than the zonal Batten approach.
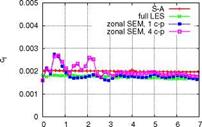
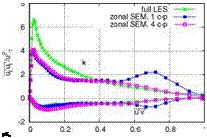
A compressible zero-pressure gradient boundary layer (Ma = 2.4, Res„ = 52000) was also investigated to evaluate the efficiency of STGM in compressible flows. A full LES simulation was used as reference and a full RANS simulation provided targets for the zonal RANS-LES solution. In this case just the zonal SEM approach was used and evaluated concerning two different control plane configurations. The first configuration uses one single control plane (referred to as ’1 c-p’) which is located at x/So = 0.7. The second configuration applies four control planes (referred to as ’4 c-p’) which are located between x/S0 = 0.3 andx/S0 = 2. Numerical details are given in Tab. 4.
The downstream evolution of the skin friction coefficient Cf is shown in Fig. 7 (left). It seems that the zonal SEM solution with one control plane already converges at about x/So = 1.5 whereas the case with four control planes still regulates
|
Fig. 6 Я2 structures of a mildly compressible flat plate boundary layer flow computed by (top) a full LES, (middle) using zonal Batten approach and (bottom) applying the zonal SEM ansatz |
|
Table 4 Numerical details for the computation of a turbulent boundary layer at Ma = 2.4 and Reg = 52000 for LES and RANS solutions
|
the shear stress budget. However, Fig. 8 compares the turbulent kinetic energy k and Reynolds shear stress (u’v1) at position x/g = 1. A second spurious peak is exhibited at y/g0 = 0.7 for the zonal SEM simulation with one control plane. This
 |
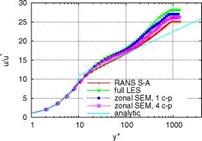 |
distribution of turbulence energy is due to the presence of a low frequency mode which is introduced at the inlet and may survive at least the first control plane. Touber et al. [25] observed the same phenomenon when applying synthetic turbulence techniques to compressible boundary layers. This might occur due to the high Reynolds and Mach numbers used here which stabilizes the outer mode. However, this mode was not found in subsonic boundary layers. When four control planes are used the flow already passes two control planes and the spurious peak in the wake region of the boundary layer at position x/S = 1 is somewhat more damped. At position x/S = 5 both control plane configurations show no trace of this second peak in the turbulent kinetic energy k. From these results it is suggested to apply more than one control plane in supersonic boundary layers at high Reynolds numbers to avoid the large wave length mode introduced by the STGM and thus to keep the transition region as small as possible. The van Driest velocity profiles obtained at x/S0 = 5 in Fig. 7 (right) show that both STGM produce the expected asymptotic near-wall behavior of a turbulent flow, but the results differ somewhat at the edge of the boundary layer.
 |
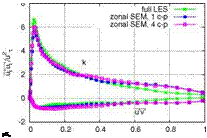 |
Fig. 7 Evolution of skin friction coefficient Cf (left) and van Driest velocity profile (right) for boundary layer flow at Ma = 2.4 and Re^ = 52000 for different computational – and control plane configurations
Fig. 8 Turbulent kinetic energy k and Reynolds shear stress (u’V) at x/So = 1 (left) and at x/ Sq = 5 (right)


