Our heavyweight helicopter equal in the world does not have
In Rostov started production of the most load-lifting rotary-wing car The Russian holding «Helicopt[...]

Everything about aircrafts and helicopters. News and events in aviation worldwide. Civil, transportation, military helicopters and airplanes.

Everything about aircrafts and helicopters. News and events in aviation worldwide. Civil, transportation, military helicopters and airplanes.

Everything about aircrafts and helicopters. News and events in aviation worldwide. Civil, transportation, military helicopters and airplanes.

Everything about aircrafts and helicopters. News and events in aviation worldwide. Civil, transportation, military helicopters and airplanes.


On most helicopters, the critical design condition is high-speed flight. To satisfy this condition, the twist is usually less, and the blade area usually more than is
optimum for maximum hovering performance. On some helicopters, such as flying cranes, however, the rotor may be designed by the hover requirement. For these cases, it is well to have an understanding of the maximum theoretical value of the Figure of Merit and how it varies with rotor parameters.
For a rotor with ideal twist, the Figure of Merit may be written in terms of nondimensional coefficients:
Induced power C pi С Ty CT/ 2
F. M. =———————– = — – ——————————
Actual power Ct Ст^Д+с_^
It may be seen that if the rotor had neither drag nor solidity, the Figure of Merit would be unity. Since neither condition applies to actual rotors, the Figure of Merit will always be less than unity. Using the relationship:
![]()
The Figure of Merit becomes:
|
|
|

![]()
This form of the equation shows that the Figure of Merit is highest for high solidities and for high values of cbl2lcd. (Note: Sailplanes have their lowest rates of sink when their values of C[/2/CD are at a maximum.) The equation represents the theoretical maximum Figure of Merit for a rotor with ideal twist, no tip or root losses, and with every blade element operating at the same angle of attack. This theoretical maximum has been compared with whirl tower results in Figure 1.12. The whirl tower Figure of Merit is from reference 1.1 and the theoretical curve is based on the NACA 0012 airfoil data of Figure 1.10, which are from the same set of tests. The difference between the two curves is due to tip and root losses, nonideal twist, nonuniform blade element angles of attack, and rotation of the wake (all of which will be discussed before we finish).
The equation for Figure of Merit can also be written as a function of disc loading and tip speed:
|
|
|
|
|
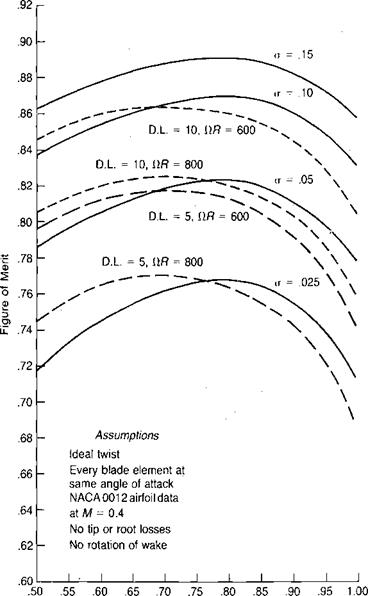
This form shows that for a given disc loading and tip speed, the Figure of Merit is maximum when cl]cd is a maximum. The apparent conflict with the previous discussion is sometimes called a paradox, but the truth of both statements is shown in Figure 1.13 on which the theoretical Figure of Merit based on the NACA 0012 airfoil data of Figure 1.10 has been plotted as a function of ct for both constant solidities and constant disc loadings. It may be seen that the curves for constant solidity peak at a ct of 0.8, which is the lift coefficient for maximum c)/2/cd, and that the curves for constant disc loading peak at a ct of 0.7, which is the lift coefficient for maximum cjcd. It should be noted that the constant disc loading lines are a function of tip speed; the lower the tip speed, the higher the potential Figure of Merit. The benefit, of course, is decreased if the higher solidity required by the lower tip speed requires higher blade weight. The equation leads us to conclusions that can also be obtained graphically, as presented in Figure 1.14. This shows the velocities and forces acting at a typical blade element of three rotors developing the same thrust. The first rotor is the baseline. The second has half the diameter resulting in four times the disc loading, which doubles the induced velocity and thus the induced drag. Since the lift-to-drag ratio is assumed to be the same, the profile drag is the same. The Figure of Merit is proportional to the induced drag
|
Average Lift Coefficient, q |
FIGURE І.13 Calculated Figure of Merit
divided by the sum of induced drag and profile drag. At the higher disc loading, this ratio is closer to 1.0 than for the baseline rotor. This explains why designers of high disc loading aircraft can claim a higher Figure of Merit than can designers of low disc loading aircraft. The third rotor has the same diameter as the baseline but only half the tip speed. The lift vector is tilted further back, leading to twice the induced drag and to a similar increase in Figure of Merit as for the second rotor. It should be noted, however, that whereas the high disc loading rotor takes almost
twice the power of the baseline, the low tip speed rotor requires about the same since the power is proportional to the product of drag and speed.
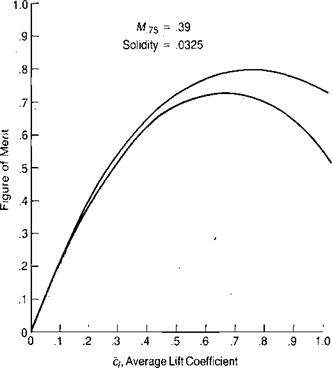
Another study of the maximum figure of Merit is given in reference 1.2. Figure 1.15 presents the results for a four-bladed rotor with constant induced velocity as the maximum attainable Figure of Merit versus thrust coefficient. The top line is the Figure of Merit assuming no drag. It is unity only for zero thrust. At higher values, wake swirl and tip vortex interactions (to be discussed later) combine to produce some unavoidable losses. The lower lines show how drag affects the results. The drag characteristics assumed for this study were simply based on skin friction as a function of Reynolds number but independent of angle of attack and Mach number as expressed by the equation:
R. N. = 6,400 cV
The family of lines essentially represents constant values of rotor solidity. Going down in solidity (up in CT/d) increases the maximum Figure of Merit. For constant solidity, increasing disc loading or decreasing tip speed increases CT and thus the Figure of Merit. In any case, the study indicates the maximum optimistic hover performance. The calculated value for the Figure of Merit for the example helicopter is shown as a point at about 0.80.