Integral defect evolution
 |
|||
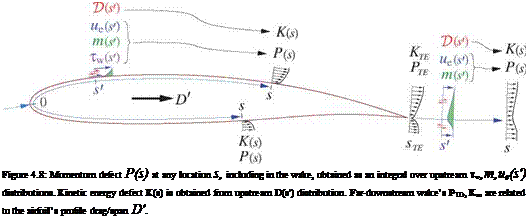
To gain insight into how the integral defects evolve along a boundary layer, and how they relate to 2D profile drag, we integrate the dimensional von Karman equation (4.26) on each airfoil side and in the wake. On the airfoil surfaces the integration runs from the stagnation point s = 0 to some surface location s, while in the wake it runs from the trailing edge sTE to some wake location s, as sketched in Figure 4.8.
Since the stagnation point momentum defect P(0) is zero, it was dropped from (4.36). And since the wall shear is zero in the wake, the Tw term was dropped from (4.37). The initial wake defect PTE in (4.37) is the sum of the upper and lower surface defects at the trailing edge.
 |
||||
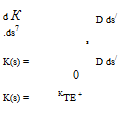
The same integration can be applied to the dimensional kinetic energy equation (4.31).
 |
The 5** term in (4.31) has been neglected since it vanishes in incompressible flow, and is usually small in any case. For adiabatic compressible flows Sato [13] has incorporated the 5** term into a modified dissipation integral D, so the forms of the integrated K(s) expressions (4.38) and (4.39) are generally valid.
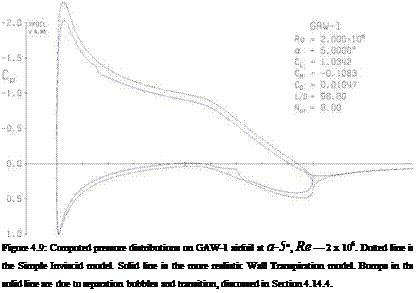
We now examine the P(s) and К(s) distributions on the GAW-1 airfoil. Figure 4.9 shows its Cp distributions at а = 5°. Figure 4.10 shows the tw(s) and D(s) distributions on the upper surface and wake, and also the corresponding defects P(s) and К(s). Also shown is the friction-only defect Pfriction(s), which then also indicates the remaining pressure defect Ppressure(s) as the difference from the total P(s).
 fs due
PpressureO = j d<§ = P – Pfl’iction
 |
We see that tw dominates the P(s) development over the front of the airfoil, but — m due/ds dominates over the back of the airfoil. In the wake, the latter term decreases P(s) due to the wake’s favorable pressure gradient, or due/ds> 0. In contrast, К(s) is strictly monotonic since its only source term D(s) is everywhere positive, including in the wake. In particular, the evolution of К(s) does not depend on the pressure gradient, except indirectly via the pressure gradient’s relatively weak influence on D.


