Self-Similar Turbulent Boundary Layers
For the laminar case we saw that the n, u ^ n, U variable rescaling (4.51) led to a self-similar boundary layer flow for a power-law edge velocity. A suitable corresponding rescaling for the outer layer of a turbulent boundary layer is
where the normalizing velocity is now the shear velocity ut, defined in terms of the wall shear stress.
UT = у-y = Ue sjc. f/2 (4.55)
Note also that this transformation addresses the defect velocity AU = U—Ue, rather than U itself.
|
f (at/+)2 d??. _ 1 / — A u+ d n sj Cf /2 6* dp Нв dt/,e tw ds Cf /2 Ue ds |
Turbulent self-similar boundary layers, also known as equilibrium flows, are theoretically possible when plotted in terms of the n, AU+ variables, and were first demonstrated experimentally by Clauser[14]. They are characterized by streamwise-constant values of the Clauser parameters G and в.
An empirical relation between G and в for equilibrium flows is known as the G-beta locus.
G(в) – A (1 + Вв)1/2 , A -6.7 , B ~ 0.75 (4.58)
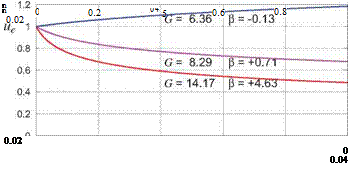
This can be considered to be the turbulent-flow equivalent of the H(A) laminar self-similar flow relation implied by Table 4.1. The form of (4.58) is based on theoretical physical models of the turbulent boundary layer (see Coles [15]), and the values of its two constants A, B are obtained from measurements of equilibrium boundary layers from Clauser [14], Simpson et al [16], and others. Figure 4.14 shows three turbulent equilibrium flows for three values of в.
Note that в > 0 is an adverse pressure gradient which results in a rapid thickening of the boundary layer, while в< 0 is a favorable pressure gradient with much slower growth. All the velocity profiles for each flow all collapse to the same AU+(n) curve for that flow. This is directly analogous to the self-similar laminar wedge flows sketched in Figures 4.11 and 4.13, whose profiles all collapse to the normalized profiles shown in Figure 4.12. The good fit to the experimental data validates the turbulent equilibrium flow concept.
The special case of a very large G corresponds to a turbulent incipient-separation boundary layer flow, analogous to the laminar H = 4.0 Falkner-Skan flow. Flows of this type have been used by Liebeck [17] to design airfoils with the fastest-possible pressure recovery without separation, which results in extraordinarily high maximum lift. A distinctive feature of Liebeck’s airfoils is a “concave” Ue(s) distribution on the upper surface, comparable to the G = 14.17 case shown in Figure 4.14.
 |
|
Figure 4.14: Three turbulent self-similar (equilibrium) flows, each with a constant Clauser pressure gradient parameter в, and corresponding constant G given by the G-beta locus (4.58). Each flow has an initial momentum-thickness Reynolds number ue6/v = 1500 at s = 0. All the velocity profiles of each flow collapse to a single normalized defect profile on the right plot. Experimental data (symbols) is from Simpson et al [16].


