Pressure Integration
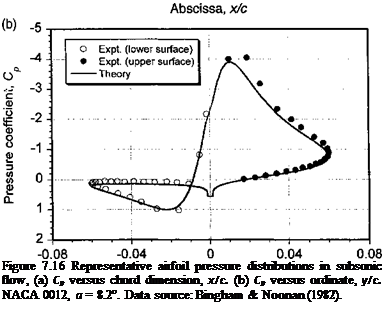
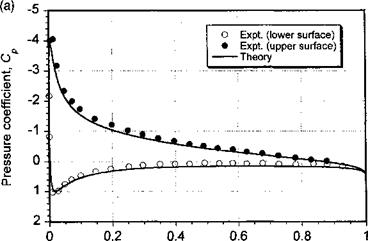
The accuracy with which the values of Cn, Ca, and Cm can be measured (or computed) depends on the number and location of the pressure points over the airfoil surface. A typical subsonic pressure distribution is shown in Fig. 7.16 and is compared to theory based on a standard panel method solution. The agreement is good, and any slight differences can likely be attributed to experimental uncertainty and wind tunnel interference effects. For subsonic flows, the suction peak and high adverse pressure gradients occur near the leading edge, so that there must be a bias of pressure points in the leading edge region to minimize
|
|
 |
Ordinate, y/c
 |
Transformed chord position, x/c
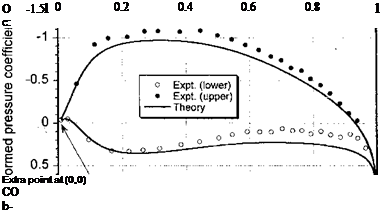
Figure 7.17 Transformation of chordwise pressure distribution to aid in numerical integration. NACA 0012, a = 8.2°. Data source: Bingham & Noonan (1982).
errors in the integration process to find the forces and moments. At higher subsonic speeds and when transonic flow develops over the airfoil, the largest pressure gradients occur downstream of the leading edge, usually near any shock waves. Therefore, the pressure points must be relocated to this region to adequately resolve the pressure distribution and maintain the accuracy in the calculation of the integrated loads. While numerically this can be easily done by respecifying the locations where Cp is to be calculated, in an experiment this is not usually possible because relocating pressure instrumentation on a wing or airfoil section can be expensive or impractical. Note from Fig. 7.16(b) that the integration with respect to airfoil thickness becomes particularly difficult if the suction peak and pressure gradients are not adequately resolved.
Special interpolation methods can sometimes be used to maintain accuracy in the calculation of total forces and moments from discrete pressure points, as long as this is done with caution. One way of improving the accuracy with sparse numbers of points in the leading edge region is to apply a transformation to the measured or computed pressure distribution. One such transformation is
which is used by St. Hillaire et al. (1979) and McCroskey et al. (1982). The transformed variables C* and x*/c are then plotted in the conventional way. This transformation has the effect of providing a better definition of the leading edge pressure peak, as shown by Fig. 7.17, and also generating an additional point at (x*/c, C*) = (0,0). The coefficients Cn and Cm[E are given in terms of the transformed variables by


