Properties of Classical and Swept Aircraft
selves felt. This can be seen from the results in Fig. A.31 for the sectional lift slope of sections near mid-semispan of two sweptback wings: the fall – off with is much steeper although, for some reason which we still do not
 |
understand, the values in the limit Cl •+■ 0 appear to be much the same for all angles of sweep. But then this need not apply in other cases, e. g. at different Reynolds numbers or when the aerofoil shapes are less simple.
![]() VISCOUS FLOW
VISCOUS FLOW
(EXP)
![]()

 0-2
0-2
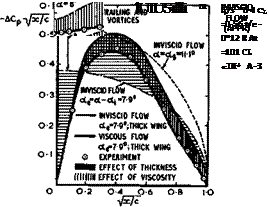
Typical experimental results for the ahondwise loading over a section near mid-semispan of a sweptback wing and for the spanwise loading over a sweptback wing of large aspect ratio are shown in Fig. 4.32, where the results in the top figure are to be compared with those in Fig. 4.29 for a similar aerofoil section in twodimensional flow. The sequence of effects to be estimated now starts with the loading over a thin aerofoil in twodimensional inviscid flow (dotted line) and then proceeds to take account of the effects of the trailing and streamwise vortices (chain-dotted line), the wing thickness (thin line), and lastly the boundary layer and wake (full line). All these effects can be estimated individually, as described above (in this case, as well as in Fig.
4.33, measured boundary-layer data have been used). If the factor к from Fig. 4.31 is known, then it can be applied to the sectional lift slope a in (4.62) or (4.104) and the spanwise loading can be calculated from (4.56) or (4.81). Threedimensional centre and tip effects then become apparent also in the viscous flow. In the lower part of Fig. 4.32, the dashed lines have been calculated for inviscid flow and the full lines for viscous flow, whereas the
Next Page
circles give experimental results. We can see how the lift reductions due to viscous effects increase with the angle of incidence and with spanwise distance from the centre. The viscous effects are large at the relatively low Reynolds number of these tests (R = 1.7 x 10^) and can be expected to be less at higher Reynolds numbers. It is thought to be a useful attribute of the RAE Standard Method that it can readily identify all these different effects in their character and magnitude. A single overall answer cannot be so instructive. This will be demonstrated again in the next example.
|
|
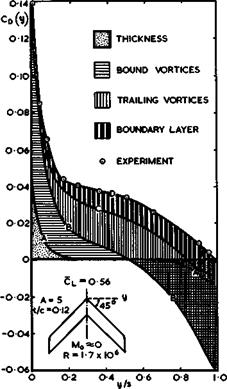
Fig. A.33 Distribution of various contributions to the form drag along the
span of a sweptback wing
To put the various threedimensional effects of sweep and viscosity into perspective, Fig. 4.33 has been drawn to show the elements that make up the pressure drag and their distribution along the span. Curve (A) is the drag (and thrust) due to thickness calculated according to (4.89) and (4.90), which varies with p(y) from (4.91) along the span. The addition to it of the drag and thrust due to lift, i. e. due to the bound vortices, gives curve (B), which is equal to C. ae at the centre (because Gj = 0 there) and varies with X(y) from (4.107) along the span, as explained in Section 4.4. Curve (B) holds for inviscid flow and its integral along the span is zero. A non-zero drag force arises from curve (C) when the vortex drag C^a^(y) is added, as calculated from (4.56) or (4.81). This corresponds to a vortex drag factor Ky = 1.16, as defined by (3.42). Finally, the pressure drag due to viscosity is added in the simple form C^ Aot(y) to give curve (D), where Да is the effective
Previous Page
overall reduction of the angle of incidence calculated from the measured boundary layer. This increases the overall drag by ACD = 0.011 in this particular case and leads to an overall drag of Cq – 0.035 and a drag factor as large as Ky – 1.72. In the experiment, only values corresponding to the final curvev(D) could be measured (circles). We find that the theoretical concepts describe the actual situation quite well. It seems that we have gained a fair understanding of the flow and thought out reasonable flow models to describe the various effects: the difficulties now lie in obtaining adequate numerical and experimental answers which the designer can use.
Both curves (C) and (D) in Fig. 4.33 represent real drags, one associated with the vortex flow in the Trefftz plane and the other with the momentum change in the wake. Both these drag elements are roughly proportional to and, the
refore, difficult to separate if the drag is determined experimentally. They must be separated in any meaningful drag analysis, especially since the viscous drag depends strongly on the Reynolds number and is likely to be smaller at full scale, as can be seen from the results in Fig. 4.1, where the values of the drag factor Ky include both the vortex drag and some viscous pressure drag. The method of E C Maskell (1972), described in Section 3.2, sets out to separate these drag components. 4
It should be clear from Fig. 4.33 how precarious the balanee is between the various flow elements on a swept wing, with the strong local centre and tip effects dominating the picture and counteracting one another. One could say that Uature abhors sweep, in view of the large forces trying to pull the centre back and the tips forward and to undo sweep. No wonder, therefore, that the essence of the design of swept wings, to be discussed in Chapter 5, is to find means to deceive Nature and to achieve flows which would not occur naturally.


