Turbulence: as a space-time chaos
When Lighthill first provided us with a theoretical foundation from which to model, study and understand jet noise, turbulence, both generally and in the specific case of the round jet, was considered to comprise a spacetime chaos, devoid of any underlying order. The standard at that time for the kinematic description of turbulence structure could be found in turbulence theories such as that of Batchelor (1953): attempts to understand and model turbulence were based on the Reynolds Averaged Navier-Stokes (RANS) equations, where the only conceptual constructs invoked, aside from those expressed in the conservation equations, are those required for closure (Boussinesq’s notion of eddy viscosity, for instance) on one hand, and, on the other, the flow entities supposed to participate in the physical processes associated with the various terms that appear in the RANS equations: fluctuation energy is ‘produced’, ‘transported’, ‘dissipated’ by virtue of interactions between stochastic flow ‘scales’ or ‘eddies’.
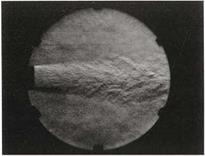
Figure 3(a), which shows a schlieren photograph of a turbulent jet, gives a visual sense of this stochastic character. Source terms in acoustic analogies
 |
 |
were constructed in accordance with this conceptual picture of turbulence. Lighthill (1952) assumed a statistical distribution of uncorrelated eddies throughout the source region, and this led to the well known U8 power law for the isothermal turbulent jet. However, predictions based on Lighthill’s analogy, using such kinematic models for the turbulence, do not explain all of the features of subsonic jet noise: at low emission angles (with respect to the downstream jet axis), for example, the U8 power law does not hold, and the narrower spectral shape is generally not well predicted. Something is missing from this combination of acoustic-analogy formulation and source representation.
(a) (b)
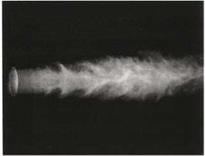
Figure 3. Different visualisation techniques of jets at similar Reynolds number, taken from Crow and Champagne (1971). (a) Schlieren photography; Re = 1.06 x 10⁵; (b) CO2 fog visualisation using sheet illumination; Re = 7.5 x 10⁴.


