Case study 2. High-resolution LES
The foregoing case study was considerably simplified by the relatively organised character of the flow solutions obtained using DNS and LESmr. In this case study (taken from Kerherve et al. (2010)) we consider a Large Eddy Simulation (Bogey et al. (2003)) with a higher order numerical scheme, which provides a flow solution with a broader range of turbulence scales in the noise producing region of the flow. This flow thus presents a greater
challenge in terms of flow feature eduction, and is in this respect a step closer to the high-Reynolds number experimental context.
|
tll/D=5.143 ORIGINAL LES CALCULATION
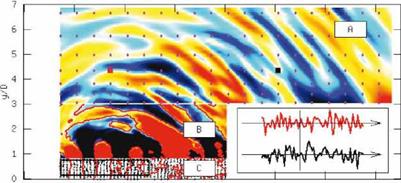
О г 4 6 8 10 13 14 x/D Figure 25. Large Eddy Simulation solution of Bogey et al. (2003), as used by Kerherve et al. (2010). Zones A: linear acoustic region; zone B: nearfield, transition from non-linear hydrodynamics to linear acoustics; zone C: nonlinear turbulent region. |
A two-dimensional slice of the flow solution is shown in figure 25. Again, in the spirit of the analysis methodology outlined in section §3, we consider, separately, the acoustic region, where we define what is to be our observable, q^, and the flow region, where we are interested in reducing qD down to qD. As seen in figure 25, the flow zone has been further split into zones B and C; the reason for this is that these zones present quite different behaviour. In zone C the flow is turbulent, non-linear, dominated by confused vortical motion, whereas in zone B fluctuations are predominantly irrota – tional, and a transition is observed, as we move radially through this region, the flow motions going from being dominated by hydrodynamics to being dominated by acoustics. It is often in this region of the flow, particularly in high Reynolds number experimental contexts, as the short historical note in section §3 outlined, that the signature of coherent structures is most easily observed.
Because of the greater complexity of both the flow and sound fields computed by this LES, we refine our definition of qA by filtering the sound field so as to only retain fluctuations associated with low-angle emission, which is believed to be predominantly contributed to by coherent structures. A frequency-wavenumber transform and subsequent filtering allows this to be achieved. The procedure works as follows. For each y— position in zone A, the pressure field is Fourier transformed from (x, t) to (kx, a):
p(kx, y,u)= [(p(x, y,t)e~j(ut+kxX’> dtdx. (110)
|
1 (кх-и/с(ві))4 a4 |
 |
 |
||
A bandpass filter is then applied, which, for a given frequency, retains wavenumbers in the range w/c(61) < kx < ш/с(в2) where c(ei)=co/cos(ei) and в і denotes a given radiation direction. The bandpass filter is defined as
The filtered pressure is then recovered by inverse Fourier transform after application of the frequency-wavenumber filter,
 pj(kx, y, a)Q(a, kx)ej(ut-k*x) dA dkx. (112)
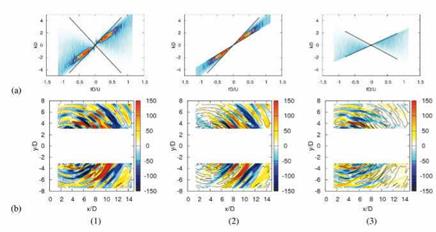
The results of the filtering are shown in figure 26. On the left the entire propagating field is shown in both frequency-wavenumber and physical space. The middle and right figures show, respectively, sound radiation in the angular sectors 0° < в < 60° and 60° < в < 120°. The space-time field corresponding to the middle image is considered the acoustic observable, qA, and we now use this to construct a filter, FqA, by which we can eliminate, from the full flow solution, any information not directly associated with sound production. What remains is then considered the sound producing flow skeleton, which we can subsequently proceed to analyse and model.
Linear Stochastic Estimation The method used in order to perform the said filtering is based on Linear Stochastic Estimation, which provides a means by which an approximation of a conditional average
q(x, t)=< q(x, t)|qA(x, t + t) > (113)
can be obtained. For the specific case considered in this study, q will be either the hydrodynamic pressure or the turbulent velocity, associated with
|
Figure 26. Top row: segments of frequency-wavenumber spectrum corresponding to radiation in different angular ranges; bottom row: corresponding instantaneous fields. Left column: 0° < 9 < 180°; middle columne: 0° < 9 < 60°; right columne: 60° < 9 < 120° |
the full LES solution, in zones B and C; qA is the acoustic pressure, filtered so as to only retain components radiating in the angular range, 0 < 9 < 60. The approach is used to determine, independently, conditional averages (which are here a function of space and of time) of the turbulent velocity and the pressure in zones B and C[18]:
U(x, t) =< u(x, t)pA(y, t + T(x|y)) > (114)
p(x, t) =<p(x, t)pA(y, t + T(xy)) >, (115)
where the time delay t(xy) corresponds to the propagation time between each flow point and each observer (obtained by means of ray-tracing).
As LSE is comprehensively dealt with in section §5 we here simply recall the main result, which is that the above conditional average can be
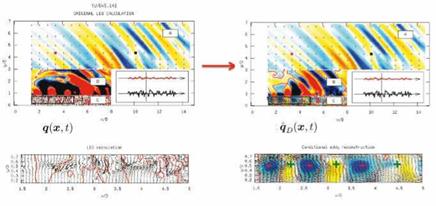
A sample of the result is shown in figure 27. Note the differences in flow field structure, in zones B and C, between the full Large Eddy Simulation solution (q(x, t); figure on left) and the result obtained by Stochastic Estimation (q(x, t); figure on right). The quantity shown in zone B is pressure, while in zone C both pressure and velocity are shown (the bottom part of the figure shows a zoom on the section of zone C indicated by the black rectangle in the top part of the figure). In zone C, the velocity field is indicated by means of black arrows (showing the velocity vector in the plane), and the skeleton of the pressure field can be discerned by means of red iso-contours indicating p(x, t) = 0 or p(x, t) = 0. In the case of u(x, t) the gamma criterion has been used to colour the velocity field. This quantity, often used as a visual aid for the study of coherent structures (Graftieaux et al. (2001),) is defined as:
 Г(Р) = U PM * ,(Um – Uf,>| A dS with
S Js ||PMH • IIUm – UP||
|
Figure 27. Left: Zone A: Low-angle filtered acoustic field; zones B and C: full LES solution. Right: Zone A Low-angle filtered acoustic field; zones B and C: conditional (filtered) flow, qp |
where P is the point where the function is evaluated, M lies in the region S centered on P-generally chosen as a rectangular area, z is the unit vector normal to the measurement plane, UM and Up are the velocity vectors at point M and P respectively, and N is the number of point in S.
The result shown in figure 27 suggests the kind of wavepacket radiation observed in the previous studies. In zone C we observe a convected train of coherent vortical structures carrying a corresponding succession of positive and negative hydrodynamic pressures. The fact that the pressure and velocity fields are estimated independently, and yet produce a result that is, qualitatively, physically consistent (high and low hydrodynamic pressures carried, respectively, by vortical structures and saddle points ), justifies our thinking about the result, q(x, t), as a sub-space of the flow.
We can now study this filtered field with a view to understanding what kind of simplified models might be appropriate where sound production is concerned. Two avenues appear worth pursuing: (1) We can decompose the field q(x, t) into orthogonal building blocks by means of Proper Orthogonal Decomposition; (2) we can study q(x, t) during periods of high-level sound emission in order to get a sense of what loud and quiet periods of flow activity look like. The first of these steps is of interest for two reasons. Firstly, the orthogonal building blocks constitute a basis that can help to characterise, and quantitively assess the degree of complexity (the number
of degrees of freedom) of, the flow kinematics. And, secondly, the same basis provides a possible framework within which to begin studying the dynamics of the reduced-complexity flow skeleton.
Proper Orthogonal Decomposition Proper Orthogonal Decomposition (POD) is presented in some detail in section §5, we therefore here simply recall the main equations and results, before applying it to the both the complete flow solution, q(x, t), and the reduced-complexity, filtered flow,
q(x, t).
The snapshot POD is used in this situation. The eigenvalues and eigen vectors of the two-time correlation function, R(t, t’), are first computed:
![]() / C(t, t’)a(n) (t’)dt’ = X(n)a(n)(t) JT
/ C(t, t’)a(n) (t’)dt’ = X(n)a(n)(t) JT
where a(n)(t) are the eigen-vectors, X(n) the eigenvalues and the two-time correlation function, C(t, t’), is defined as,
with nc = 3 the number of components of the vector velocity field (when POD is effected on the pressure field, nc = 1) and T the duration of the data set. An associated set of spatial functions T(n)(x) can be obtained by projection of a(n) (t) onto the velocity or pressure fields:
T(n)(x) = / a(n)(t)uj(x, t)dt with i = 1,..,nc. (122)
iT
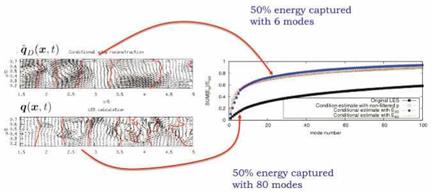
The result of the POD can provide two pieces of information. The convergence of the eigenspectrum, shown in figure 28, gives a sense of how many POD modes are required to represent the flow: if the convergence is rapid a large portion of the flow energy is captured with relatively few modes, if it is slow we require a large number of modes to capture the same energy. The former situation indicates that the flow is relatively organised, while the latter indicates a more disorganised flow. The spatial modes Ф) give us a sense of the characteristic spatial structures that dominate the flow.
The eigenspectrum, shown in figure 28, shows that while the eigenspec – trum associated with q has a slow convergence, 80 modes being required to capture 50% of the energy, that of q is considerably more rapid, only 6 modes being necessary to represent the same percentage of the associated fluctuation energy.
![]()
|
|||
|
|
||
|
|||
|

The eigenfunctions, shown in figures 29 and 30, emphasise once again the orderly, wavelike character of q, in terms of both the velocity and the pressure fields, over the first five or so diameters. Two characteristic space scales can be distinguished in the velocity eigenfunctions: one is of the order of the jet diameter, manifest in modes 0 and 1, representative of activity towards the end of the potential core, and a second, smaller space scale is observed, in modes 2 through 5, representative of structures further upstream in the annular mixing-layer region of the flow. The pressure eigenfunctions are all characterised by similar scales; they peak farther upstream and there appears to be a distinction between modes 0 through 3, which have reflec – tional symmetry with respect to the jet axis, and modes 4 and 5 which are antisymmetric. These symmetries are most likely the two-dimensional signatures of axisymmetric and helical wavepackets.
Source mechanism analysis We now, finally, consider the space-time characteristics of q associated with high – and low-level sound emission. Comparison of the pressure signature on the centerline of the jet gives a
|
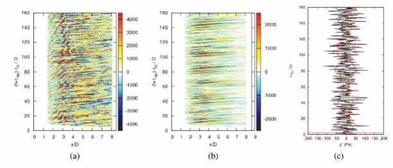
Figure 31. (a): (x, t) structure of full pressure (qp) on jet centerline; (b) (x, t) structure of reduced pressure (qp) on jet centerline; (c): black line: acoustic pressure (q^) at 30°; red line: short-time Fourier series of signal. Figure (c) has been time-shifted to account for propagation times, such that events at a given time are comparable with events in (a) and (b) at the same time-coordinate. |
clearest indication of how the orderly component of the flow fields behave. Figure 31 shows this quantity for the full LES solution, qp(x,t) and the reduced flow, qp(xi, t), and these are compared with the acoustic signature,
q^(t), sampled at an angle of 30°. The latter has been time-shifted such that a direct comparison can be made with the two signals. Furthermore, the acoustic signal has been transformed by means of a short-time Fourier series and the result is shown in red. This operation provides a means by which the loud portions of the signal can be more easily identified.
 |
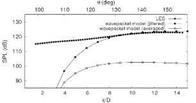 |
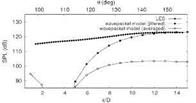
Examination of the figure shows the following. While it is difficult to discern any particular relationship between the hydrodynamic centerline signature of the full flow solution and the radiated sound, analysis of the same metric of the reduced field, qp, reveals a clear correspondence between the growth and decay of wavepackets (modulation of both their amplitude and axial extent is observed) and high-amplitude sound radiation. The fitting procedure applied in the previous study is repeated here using the filtered flow field, q, and the jittering line source ansatz. The result is shown in figure 32. Good agreement is found between the acoustic observable, q^,
(a) (b)
Figure 32. Comparison of sound field computed by Large Eddy Simulation with time-averaged and jittering wavepacket ansatz. (a) ansatz fitted with conditional field data, q, after radial integration; (b) ansatz fitted with conditiona field data, q taken from mixing-layer axis.
and the modelled sound field, q^, showing once again that the filtering procedure has been effective in the eduction of the sound-producing flow skeleton (kinematics).
4.2 Conclusions
Two case studies have been used, by way of example, in order to illustrate implementation of the analysis methodology outlined in section §3. In both cases, by following the methodology, kinematic models are constructed that mimic the sound-producing behaviour of the three different jets analysed. The quantitative accuracy is in all cases better than 1.5dB, showing the analysis methodology—which combines the data-analysis tools
presented in section §5 with the theoretical reasoning outlined in section §3—to be effective with regard to the kinematics of sound source mechanism identification. For the dynamic aspect further tools are necessary; these are presented briefly in section §6.


