HORIZONTAL TAIL CHARACTERISTICS
 The horizontal tail surface is a lifting device, similar to the wing and is appreciably affected by the fuselage to which it is usually attached.
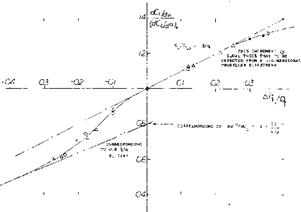
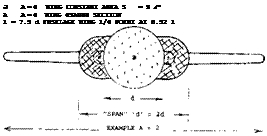
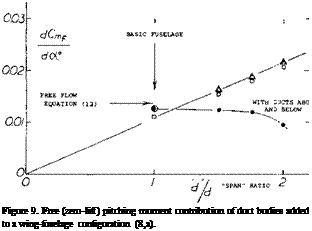
Cross Flow. Fuselage interference upon the horizontal surface located in the conventional location “at” the tail is twofold. There is first the cross-flow effect mentioned above in connection with wing plus fuselage combinations. Figure 5 suggests, when placing a wing or a tail surface at or near the end of a fuselage, that the destabilizing (positive) fuselage moment will be increased above its value in free flow (without the tail surface present). This is evidently a consequence of the “2or ” type upwash (5) ahead of the leading edge of the horizontal surface. If the fuselage’s destabilizing moment is increased, the stabilizing effect of the body-tail combination is reduced, accordingly. For an average conventional configuration, the maximum increment A M/M^h ^ 0.5, as at xff~^ 1, in figure 5, can be found to be equivalent to a reduction of the stabilizing moment of the wings (larger than tail surfaces) represented in that graph and in the order of several percent.
Stalling. The above discussion regarding wing-fuselage interference, primarily applies at small and moderately high lift coefficients. At the higher lift coefficients, stalling in straight wings is likely to begin at the roots, where the flow is strained the most. The pitching moment changes, accordingly, in negative (stabilizing) direction. For example, in the wing-fuselage combinations tested in (7,b, c) values of in the order of — 0.1 or even — 0.2, can
be observed wnen stalling. The corresponding shift in the center of lift is between 8 and 16% of the wing chord (to the rear). Longitudinal stability is improved as a result of stalling (returning the airplane to lower angles of attack) a) because of the shift in the center of lift and b) from the reduced downwash in the center of the wing (along the fuselage). Fillets, designed to postpone wing-root stalling, will be discussed later, in connection with downwash. [103]
Fuselage Interference. As pointed out in “Fluid-Dynamic Drag” (9) when adding a fuselage to the horizontal surface, its lift distribution is usually disturbed (possibly interrupted) by the boundary layer of viscous wake developing along the fuselage. To demonstrate this effect, we present first the situation as in figure 10, where a wing (or tail surface) is placed in a wind-tunnel stream, in the center of which the velocity distribution is “dented” (in, the direction normal to the span of the wing). After integrating the dynamic pressure across the span of the lifting surface, we obtain an average Aq/q which may also be considered to be a gap in the stream (normal to the surface) having a width bg/bH = Aq/q. The lift and/or the lift-curve slope of the wing is reduced on account of this gap in its center, not just in proportion to the average dynamic pressure, but at a rate increasing with the size of the gap. Qualitatively, the result in figure 10 can be explained:
a) when reducing the lift in proportion to the average dynamic pressure, thus accounting for a reduction of effective area corresponding to the “gap”;
b) when reducing the effective aspect ratio as a function of Aq/q in the manner as described in “Fluid-Dynamic Drag” (9).
![]()
![]() 5(10)5
5(10)5
|
t/c =: 14% CAMBERED
|
0.8 m
|
Figure 10. Influence of a dent or gap in the velocity and/or dynamic pressure distribution, upon the lift of a wing or a horizontal tail surface (14,c). The dent is two-dimensional, up and down, and not limited as a fuselage wake (or a slipstream) would be. |
The lower limit indicated in the graph, corresponds to A[ = 0.5 A (q/q), used in the equation (taken from the Chapter III)
do?/dCL = 11 + (20/Al) (15)
The experimental points drop from the upper line (corresponding to (a) above) to that lower limit. The reductions of tail efficiency thus obtained, are greater than those derived above under “cross flow”. A horizontal tail is basically smaller than the wings in figure 5; and the viscous type of fuselage interference is predominant, accordingly.
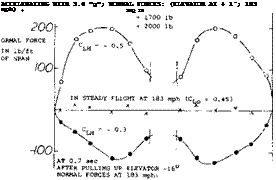
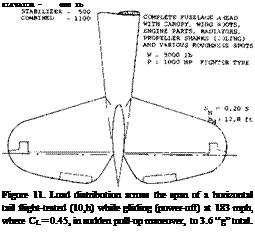
The Load Distribution across the span of the horizontal tail surface of a “typical” fighter airplane was measured in flight (10Jh). Considering the cut-out for the rudder, it may not be surprising that the distribution shown in figure 11 has a considerable dent (deficiency) when suddenly pulling up (thus producing a negative load). However, the same type of dent is obtained after 2 seconds, when the airplane has reached a certain angle of attack, giving it zz constant acceleration (and constant lift) corresponding to a total of 3.6 “g”. For an elevator angle now near neutral, the tested lift coefficient CLH = + 0.5 is essentially due to angle of attack, thus including the cross-flow assistance by the fuselage (if there is any). The distribution obtained can be analyzed in two different ways;
a) We can assume that the airplane’s fuselage (including canopy, wing roots, engine parts, radiators, shanks of the idling propeller, and various spots of roughness) may have a drag corresponding to ACD= 0.01 (on wing area). Based on horizontal area Sw = 0.2 S, a coefficient CDH = 0.01/0.2 = 0.05 is then obtained. According to the evaluation in Chapter VIII of “Fluid-Dynamic Drag”, a ratio of Aj. /A = 0.6 is then found.
b) If completing the lift distribution in figure 11, across the span in elliptical form, a load can be estimated as follows:
L = 250 (тг/4) 12.8 = 2500 lb
where 250 = maximum lb/ft in the center, and 12.8 = bH. This load is 1.25 times as high as tested. To account for the difference, we will first assume a reduction of effective area by 10%. Using the basic equation for the “lift angle” (see Chapter III)
doc/dCL= (11°/0.9) + 207(0.9 (AjA) 3.4) =12+6.5 /(AJA)
where 3.4 = Ац = geometrical aspect ratio including the part covered by the fuselage. Solving this equation twice (once for AjA = 1.0, and once for an estimated ratio in the vicinity of 0.6, as in (a) above) a ratio of A^ /А = 0.59 is found for the lift angle ratio of 1.25 estimated above. This result agrees with that in (a).
(10) Characteristics of horizontal tail surfaces:
a) Letko, Fuselage with Tail (23,c), NACA TN 3857 (1956).
b) Lyons, Lift of Control Surfaces, ARC RM 2308 (1950).
c) Greenberg, Free Control Analysis, NACA T Rpt 791 (1944).
d) Plate Interference, NACA TN 408 & W Rpt L-660.
e) For Airship Fins, see NACA T Rpts 394 and 604.
f) Engelhardt, Interference of Fuselage Upon Horizontal Tail, Aerody Lab TH Munchen Rpts 1 and 3/1943.
g) Gillis, Fuselage Plus Tail, NACA W Rpt L-391 (1942).
h) Garvin, Load Distribution in Flight, NACA TN 1483 (1947).
i) Polhamus, Stability with “V” Tail, NACA TN 1478 (1947).
Cmuw= where-MH = pitching-moment differ
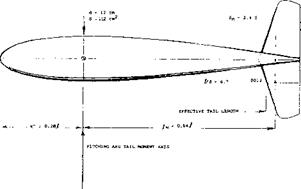
 ential due to horizontal tail, this coefficient should theoretically be equal to CLH. However the moments as tested (10,f) were some 5% less, which means that the effective tail arm is 5% shorter than the geometrical arm. This reduction, indicated in figure 12, is discussed later, under “effective tail length”.
|
|
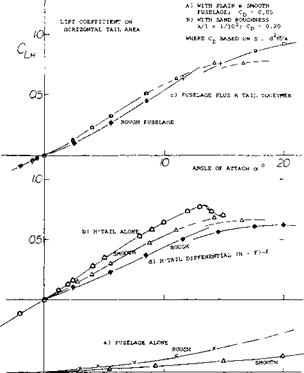
Surface Roughness. To prove that the viscous wake of the fuselage has considerable influence upon the horizontal – tail effectiveness, some basic tests were made (10,,f). The stabilizing tail moment was determined both on a smooth and on a rather rough fuselage body. At angles of attack between 6 and 8°, differentials ACmw/Aod, taken from figure 12, are as follows:
|
smooth |
ratio |
rough |
ratio |
|
|
tail plus fuselage |
– 0.046 |
0.70 |
– 0.037 |
0.56 |
|
tail differential |
– 0.054 |
0.82 |
– 0.042 |
0.64 |
|
for H’tail surface alone |
^•С^ц/Доб |
= |
– 0.066 |
1.00 |
The tail differential effectiveness is reduced 18% in presence of the smooth fuselage (having a basic drag corresponding to CD = 0.05, or CDH = 0.02) and 36% for the rough fuselage (with CD = 0.20, or Сой = 0.08 ). Obviously, the effectiveness reduces as a function of the fuselage drag, as explained in (9). If defining the coefficient
Figure 12. Example for the interference of a fuselage body upon the effectiveness of a horizontal tail surface as tested (10,f) RM = 4(10)5.
A) with plain and smooth fuselage; CD = 0.05
B) with sand roughness k/1 = 1/103; CD = 0.20 where CP based on S = d2/4.
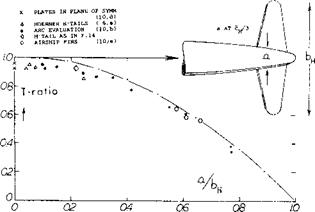
Statistical Evaluation. In a typical (but smooth) configuration, the fuselage-tail interference may be such that the effective aspect ratio is reduced to AWf- ~ 0.7 AH. The corresponding reduction of a conventional tail’s lift-curve slope can be expected to be in the order of (1 — 0.7)/3 = 10%. Note that in this formulation, the viscous influence of the fuselage (usually expressed in form of a reduction of the dynamic pressure at the tail) is “fully” accounted for. In other words, we do not assume that the average dynamic pressure across the span of the horizontal tail, would be reduced in the order of 10%, simply because there is a wing ahead the wake sheet of which m ay not, or should not impinge upon the tail surface. Statistically, wetted surface and drag of the fuselage is proportional to (I or d or a)2, where Д = length, d = maximum diameter, and a as indicated in figure 13. At least for small a/b ratios and/or for smaller aspect ratios, it can then be shown that the reduction A(dCL /doc.) is proportional to (а/Ьц )2 . The corresponding theoretical function presents an upper limit to the experimental ratios on figure 13. Even the fins of airships (in the vicinity of (a/bH ) = 0.6— fit into the statistical pattern. Tentatively, for “smooth” fuselages, the ratio of lifting effectiveness, in comparison to that of the horizontal tail alone (without interference) is
T-ratio = (0.94 — 0.02) (1 – (а/Ьи f)
|
Figure 13. Statistical evaluation of the interference effect of the fuselage upon the stabilizing effect of horizontal tail surfaces. |
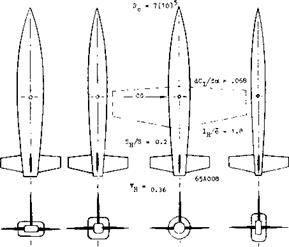
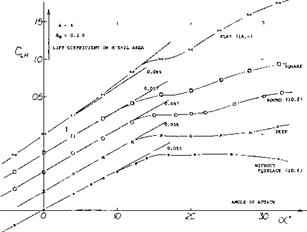
Fuselage Shape. Results of a wind-tunnel investigation (10,a) of a horizontal tail tested at the end of four fuselage bodies, differing in cross-section shape, are presented in figure 14. Differentials taken between oc = 0 and 8 , based on horizontal tail area are listed in the illustration. The loss of lift in the presence of the fuselage (corresponding to the horizontal lift ratio”) is between 6 and 15%, caused by interference of plain and smooth fuselage bodies as described above. When added to the fuselage, the horizontal tail appears has the least interference of lift and moment in combination with the “deep” and/or the circular shape. By comparison, the square shape seems to cause some disturbance at the roots of the horizontal tail, v/hile the flat shape although having the highest combined lift-curve slope, may suffer somewhat from too much cross flow at the tail roots thus resulting in a differential ratio of only 0.85.
|
|
|
FUSELAGE SHAPE |
acj/dcr F + H |
acL/do< (F+H)-F |
H1 LIFT RA. TIO |
ac/a<x FUSELAGE |
&c /&a m F+H |
4°^ or (F+H)-F |
X/IH |
HT EFFIC |
|
"DEEP" |
.056 |
.050 |
0.94 |
+.0036 |
-.0163 |
-.0199 |
0.91 |
0.85 |
|
CIRCULAR |
.057 |
.049 |
0.92 |
+.0050 |
-.0135 |
-.0185 |
0.94 |
0.85 |
|
SQUARE |
.057 |
.046 |
0.87 |
+.0055 |
-.0135 |
-.0190 |
0.87 |
0.76 |
|
"FLAT" |
.065 |
.045 |
0.85 |
+.0105 |
-.0080 |
-.0180 |
0.90 |
0.77 |
|
H’TAIL |
ALONE |
.053 |
1.00 |
H’TAIL |
-.0200 |
-.0200 |
1.00 |
1.00 |
|
C IS BASED ON THE DIMENSIONS OF THE WING FOR WHICH THE FUSELAGE AND TAIL m ARE INTENDED TO BE USED, CORRESPONDING TO VH = 0.36. FOR EXAMPLE, IN THE FIRST LINE; 0.05(.36) – 0.018; 0.018/0.0199 = 0.91? 0.91 (.94) = 0.85. |
|
|
Figure 14. Influence of fuselage shape, and interaction with the horizontal tail surface, in regard to longitudinal stability (10,a).
Effective Tail Length. The stability, does not depend the lift produced by the horizontal tail surface, but rather on the pitching moment obtained from the equation.
dCm4/dCL = (dCLH /doc) (SH/S) a /с) (16)
In other words, the moment arm of the tail is important and that arm is not necessarily equal to the geometrical dimension measured to the 1/4 chord point. For example, in the first line of the tabulation in figure 14, the effective arm “x” corresponds to хЦц = 0.050 (0.36)/0.0199 := 0.91, where 0.36 = tail volume VH = (SH/S) CfH/c). The horizontal tail as tested on three of the fuselage shapes, produces moments corresponding to arms which are between 6 and 13% shorter than the geometrical distances measured to the CG location of the airplane configuration for which the tests were undertaken. There is probably some mutual interaction, upwash (as explained under “cross flow” above) and viscous-type lift of the fuselage “at” the trailing end (see context to figure 7). Considering net stabilizing effect of tail plus fuselage (F + H) the “deep” shape in figure 14, is seen to be the most effective one (with ДСт//Лос°= – 0.0163). This cannot be a general conclusion, however. It seems that the arrangements as tested, with 53% of the fuselage length forward of the CG, is not typical. If, for example, selecting the 1/4 point of the fuselage length as reference or CG point, the flat fuselage configuration emerges as the most stable, with ЛСт/Лос ~ — 0.050 for (F + H), in comparison to — 0.040 as for the square shape, and ~ — 0.035 for the two other forms. Thus, to improve stability, it would be profitable to make the forebody “deep” or round (and short), while a flat or square (and long) afterbody can be expected further to contribute to longitudinal stability.
Horizontal Tail Contribution. Longitudinal characteristics of a simple airplane configuration are presented in figure 15. Evaluation of tail effectiveness leads to results as follows:
a) The loss of effectiveness of the horizontal tail due to fuselage interferences is 9%. The effectiveness ratio is 0.91, accordingly.
b) When adding the fuselage to the wing plus tail arrangement (as tested without fuselage), an effectiveness ratio of 0.023/0.0265 = 0.87 is obtained.
The fact that the tail moment under (b) is somewhat less than under (a) can be explained by way of increased downwash (to be discussed later).
|
23012 |
I ~ | AH = 3.7; VH =0.15 (3.4) = 0.5
a) PERFORMANCE OK HORIZONTAL TAIL SURFACE:
CONFIGURATION TESTED (dCm,/dtf ) (dC^ /6) RATIO EXPLANATION
HORIZONTAL TAIL ALONE -0.023 -0.33 1.00 ON WING DIMENSIONS
MOUNTED ON FUSELAGE -0.021 -0.30 0.91 FUSELAGE INTERFERENCE
BEHIND WING (NO FUSELAGE)-0.011_ -0.15 0.45 IN WING DOWNWASH
IN COMPLETE CONFIGURATION -0.009_ -0.13_ 0.39 DOWNWASH & FUSELAGE
|
NOTE THAT 0.39/0.45 = 0.87 IS LESS THAN 0.91; FUSELAGE — INCREASED DOWNWASH b) CHARACTERISTICS OF CONFIGURATION;____________________________________
(+) NO FUSELAGE PRESENT |
Figure 15. Longitudinal characteristics of a simple airplane configuration
wing: b/c = 5; 23012 section; Rc = 4(lo/ ; ref. (16,a)
fuselage: 1/d = 7; 1/b = 1.0; see also figure 6.
Free Elevator. In wind-tunnel investigations, longitudinal and/or other stabilities are usually tested with the control flaps (elevator) fixed. As explained in the Chapter IV, the lift-curve slope usually reduces in the “stick-free” condition. Since it is desirable that an airplane remains stable for the stick free case the design and/or CG location should be such that a correspondingly reduced tail contribution can be tolerated. The reduction to be expected for an average conventional tail surface due to the stick free case may be in the order of 15%. However, tab-balanced control flaps can reduce tail effectiveness much more, while a large overhanging-nose type of balance may not reduce stability at all.
General Method. To obtain the stabilizing moment of the horizontal surface the following procedure is used:
a) Find in Chapters III & IX the lift-curve slope of the isolated tail as a function of aspect ratio, including such effects as roughness and control or balance gaps.
b) Determine the effective aspect ratio, reduced as a consequence of viscous fuselage interference, as explained above (9), or use directly the effectiveness ratio as in figure 13.
c) Use in the determination of the pitching moment, an arm which is somewhat shorter than the geometrical arm, either by 10%, or by a differential equal to 1/2 the maximum fuselage diameter.
For conventional (more or less “round”) and completely smooth fuselage shapes, it may also be said that the horizontal tail together with the fuselage may produce almost the same lift as the tail surface alone. This seems to be true in a smooth-fuselage-tail configuration reported in (10 ,g). A similar result is found for the configuration as in figure 14, with the round fuselage shape. Then using an arm reduced, say by 10%, the right order of magnitude of the stabilizing moment may be obtained. Less horizontal tail contributions may apply in full-scale conditions, however, as explained in connection with figure 11.
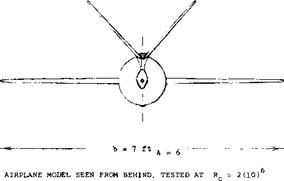
“V” Tail To reduce drag and weight the vertical and horizontal surfaces have been combined in form as shown in figure 16. As pointed out in Chapter III, the panels of such a “V” tail retain their normal force derivative dCfl /do^h where ocn = angle of attack measured in the direction normal to each panel’s axis. Since L = cos"!*1, and ocn := c* cosr, the lift curve slope of a “V” tail (when used in longitudinal direction) can be expected to be
(dCL/doOH = (dCM/d*n) cos2r (17)
where P = angle of dihedral, and the coefficients are based on combined panel area. For dCN/do^n the value of the same tail at Г = 0, is to be used, including fuselage interference. The plain configuration investigated in (10,i) exhibits essentially straight C^Cl ) functions within the range of lift coefficients below CL = 0.8, with CL* = 1.0. The corresponding derivatives are plotted in figure 16. The results are as follows:
a) To make an airplane stable, the folded-down “V” tail area has to be larger than that of a straight horizontal surface. On the basis of a conventional S^/S = 20%, a “V” tail area
Sv/S = 0.2 cos? r (18)
may thus be needed. In the design as in (10,i) a 41% tail surface ratio was used.
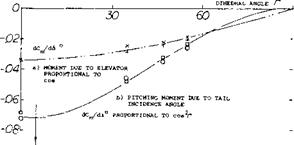
b) When varying the dihedral angle of the “V” surface, the derivative dCm/di (where і = angle against fuselage) changes corresponding to equation (17).
c) The axes about which the elevator flaps are deflected, have directions different from that of the angle of incidence. Therefore, as derived from “V” geometry, and as shown in figure 16, the derivative varies as
dCm/d6 ~cos T (19)
|
|
|
sv |
= 0.29 |
b |
EACH "V" TAIL PANEL |
|
Sv |
= 0.41 |
S |
COMBINED AREA "V" TAIL |
|
sf |
= 0.18 |
Sv |
"ELEVATOR" FLAP AREA |
|
f H |
= 2.9 |
c |
MOMENT ARM OF TAIL |
|
V V |
= 1.2 |
– |
TOTAL TAIL "VOLUME" |
|
0.085 = LIFT-CURVE SLOPE AT M = 0.3 |
|
|
|
Figure 16. Shape and characteristics of a “V” type combined tail-surface assembly, tested (10,i) on a plain mid-wing wind – tunnel configuration. |
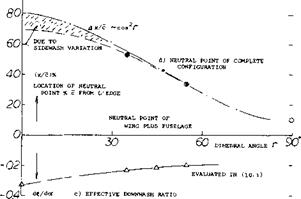
Sidewash. As explained in (10,i), a “V” tail surface is subjected, not only to downwash (in vertical or normal direction) but also to some sidewash induced by the wing’s lateral tip vortices. With the tail located above the vortex sheet, each panel of the tail in figure 16 receives sidewash in a direction toward the vertical plane of symmetry. As a consequence, their aerodynamic angle of attack (normal to their axis or edges) is increased. The
effective downwash angle (derived from the pitching moment contribution) is reduced accordingly. As plotted in part (c) of figure 16, a reduction from dS/daf = – 0.33 to – 0.21 (id est by ^ 1/3) is thus possible. The stability of the airplane model tested, basically varies corresponding to the neurtral-point location
![]()


 Дх/с: dCAnH/dCL/ —cos2r (20)
After modifying this function with (1 + d£/’doc) the variation as in part (d) of the illustration is correctly obtained.
Tail Size. Of course, when folded down toT1 = (), a tail surface with Sv/S = 41% (as in figure 16) is no longer suitable, and the location of the neutral point at 70% c would not make an efficient design. About 1/2 the area can be expected to be sufficient, while a vertical surface (in a size corresponding to Sv/S ~ 10%) will be needed. In conclusion, when using a combination “V” tail, it does not seem to be certain that any wetted area and skin – friction drag would be saved. There are other advantages, however, to a “V” tail. Therefore this type of tail will be discussed further, in connection with “multiple-engine” airplanes as well as in the Chapter XII dealing with “lateral stability”.


