Maximum Lift and Stall Characteristics
As previously noted, at higher angles of attack the adverse pressure gradients produced on the upper surface of the airfoil result in a progressive increase in the thickness of the boundary layer and cause some deviation from the linear lift versus AoA behavior (see Fig. 7.8). Eventually, the flow7 will separate causing stall. On many airfoils, the onset of flow separation and stall occurs gradually with increasing AoA, but on some airfoils, particularly those with sharp leading edges, the flow separation may occur quite suddenly. In the stalled flow regime, the flow over the upper surface of the airfoil is characterized by a region of fairly constant static pressure. The pitching moment about-the 1/4-chord is much more negative (nose-down) because with the almost constant pressure over the upper surface the center of pressure is now close to mid-chord. Less lift is generated by the airfoil because of the reduction in circulation and loss of suction near the leading edge, and the drag is greater. In addition, under these separated flow conditions, steady flow no longer prevails, with turbulence and vortices being shed alternately from the leading and trailing edges of the airfoil into the wake. Measurements will generally show fairly large fluctuating forces and moments on the airfoil under stalled flow conditions.
One of the most important characteristics used to judge the performance of an airfoil is the maximum static lift capability. This is a quantity that is not easily predicted, even with state-of-the-art computational methods, and reliance must be placed on experimental
rements. However, even from an experimental perspective, absolute values of Cr
are difficult to guarantee with high precision, and especially between tests performed in different wind tunnels. This is mainly because of the uncertainties associated with the testing technique, the aspect ratio of the wing or airfoil specimen, tunnel wall interference effects, and different turbulence intensities in different wind tunnels. McCroskey (1987) gives a good overview of the problem. However, it appears that if airfoil measurements are performed in a consistent manner and to uniform data accuracy standards, such as those defined by Steinle & Stanewsky (1982), the measurements can be considered reliable. However, the formation of test specific 3-D stall developments near maximum lift are difficult to avoid – see Moss & Murdin (1965). See also Prouty (1975) for a survey of rotor airfoil measurements.
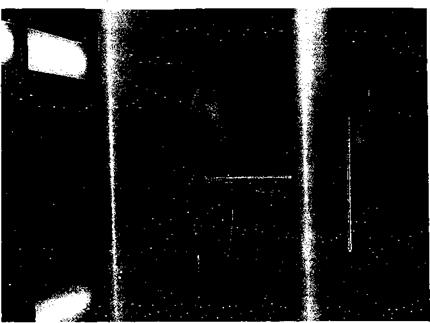
Most of the understanding about the aerodynamics of helicopter airfoil sections comes from “2-D” testing in a wind tunnel. However, there are some special considerations that must be understood and appreciated when attempting to interpret the 2-D characteristics of airfoil sections. These issues are especially important when comparing the relative perfor – mance of different airfoils TTcuallv in 2-D tectinc thA airfni! fwina^ is-made, to fnllv span one dimension of the wind tunnel, that is, across the height or width of the test section. This has the effect of making the specimen appear to be of infinite (high) aspect ratio. The pressures around the airfoil at mid-span are measured using pressure taps connected to a scanning valve and a pressure sensor, or by individual pressure sensors directly. At the midspan, 3-D effects and wind tunnel wall interference effects are much smaller. Alternatively, the test airfoil may often be placed in a 2-D insert, as shown in Fig. 7.30. This reduces the span of the test airfoil, while still maintaining nominally 2-D flow.
Note that no matter what aspect ratio is used for the wing, 3-D separation will ultimately occur – an effect first studied by Moss & Murdin (1965). If this 3-D effect is severe, then
|
Figure 7.30 Sectional airfoil characteristics may be measured using 2-D airfoil testing, in this case involving the use of a special insert installed in the wind tunnel. |
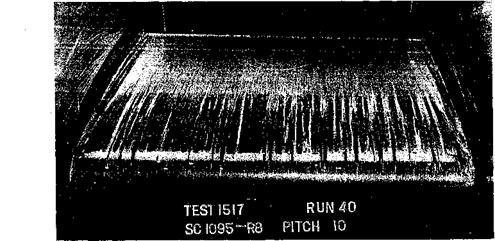
it will almost certainly affect the airfoil characteristics at the mid-span measuring station. Thus, some knowledge of the 3-D stall development on the test airfoil is always essential, especially when comparing the aerodynamic behavior of different airfoils near maximum lift. Figure 7.31 shows a helicopter blade section being tested in a 2-D insert. The flow is rendered visible by surface oil flow in which titanium dioxide power has been dissolved; this gives a white flow pattern on the black painted surface of the airfoil. The photo shows
|
Figure 7.31 Airfoil specimen being tested in a 2-D insert. The flow is rendered visible by surface oil flow visualization showing that a laminar separation bubble forms near the leading edge of the airfoil. |
the leading edge of the airfoil (looking downstream). Note the “scarf’ vortex wrapped around the junction between the airfoil and the wall, which tends to keep the flow attached there. The small region of laminar flow is terminated by a laminar separation bubble, which is evident from the accumulation of oil in a narrow band spanwise along the airfoil (see also Fig. 7.5). This bubble has been burst in places by small imperfections in the surface of the airfoil, which causes premature transition to a turbulent boundary layer. The results reinforce how laminar boundary layers are extremely sensitive to disturbances. Downstream of the laminar separation bubble, the boundary layer is fully turbulent. The surface shear stress decreases toward the trailing edge, so the boundary layer ultimately begins to separate from the surface. For this airfoil, the stall mechanism was by means of the trailing edge stall mechanism; that is, the progressive movement of the turbulent trailing edge separation point forward toward the leading edge of the airfoil for increasing AoA.
Abbott & von Doenoff (1949) have documented a summary of airfoil section measurements made at Reynolds numbers of 3 to 9 million and Mach numbers up to 0.2. These Reynolds numbers are close to the range encountered by the retreating blade on a full-scale helicopter rotor and provide a consistent basis from which to review the stall characteristics of airfoils, in general. The maximum lift that can be developed by an airfoil when operating at a steady AoA is related to the type of stall characteristic of that airfoil. At low speeds, airfoils generally fall into three static stall categories, as identified by McCullough & Gault (1953) and Gault (1957). These types are thin-airfoil stall, leading edge stall, and trailing edge stall. The results show that thin-airfoil and leading edge stalls can be fairly sensitive to changes in airfoil shape, whereas trailing edge stall is insensitive. Most conventional helicopter rotor airfoils fall into the category of trailing edge or leading edge stall types at low to moderate Mach numbers. It is also common for a mixed stall behavior to occur on some airfoils, which is a stall characteristic that is not clearly one type or another.
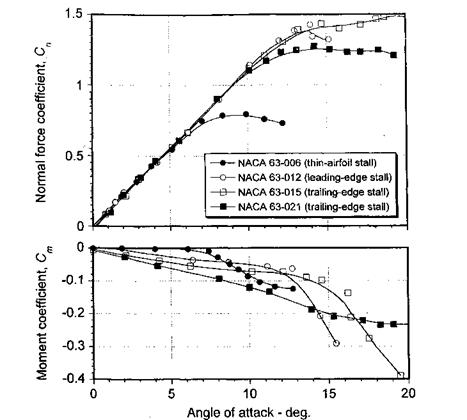
The three low speed static stall characteristics can be illustrated by comparing the lift and moment results for a given family of airfoils that have different thickness-to-chord ratios. For example, Fig. 7.32 shows results for the NACA 63 series airfoil section for thickness – to-chord ratios of 6%, 12%, 15%, and 21%. Thin airfoil stall occurs on the NACA 63-006 airfoil. The sharp nose radius produces high adverse pressures near the leading edge, which results in separation of the laminar boundary layer at low angles of attack. Initially the flow reattaches as a turbulent boundary layer, but as the AoA is increased the turbulent reattachment point moves aft producing a long separation bubble. The formation of the bubble often causes a slight nonlinearity in the lift-curve-slope at moderate angles of attack, say between 3° and 7°. Ultimately, the boundary layer fails to reattach and the airfoil stalls. Thin airfoil stall occurs mainly at low Reynolds numbers and, as shown by Fig. 7.32, it involves a fairly gentle lift stall characteristic with a break in the moment curve at low AoA. This is followed by a progressive increase in nose-down pitching moment as the separation bubble envelops more of the upper surface of the airfoil. Airfoils that exhibit thin-airfoil stall also tend to show considerable hysteresis in the airloads, and different results can be obtained depending on whether the AoA is set in the wind tunnel before turning on the flow or vice versa. The former tends to replicate flow reattachment from stalled conditions. This problem is called static stall hysteresis.
The NACA 63-012 airfoil exhibits what is known as leading edge stall. This airfoil achieves a much higher value of maximum lift, followed by an abrupt stall leading to sharp breaks in the lift and moment curves. The leading edge stall mechanism involves the participation of a laminar separation bubble in the leading edge region, as previously discussed and shown in Fig. 7.6. Transition to a turbulent boundary layer occurs at this bubble. While the airfoil is sufficiently thin to promote laminar separation, the adverse
|
Figure 7.32 Lift and pitching moment characteristics of the NACA 63-series airfoil sections with different thickness-to-chord ratios. Data source: Abbott & von Doenhoff (1949). |
pressure gradients are mild enough to cause the transitional turbulent boundary layer to reattach forming this bubble, which is typically 2-3% of chord and is normally situated immediately downstream of the leading edge suction peak in the region of steepest adverse pressure gradient. As the AoA is increased, this bubble moves forward on the chord toward the leading edge. Eventually, the adverse pressure gradient becomes more severe, preventing the turbulent boundary layer from reattaching to the surface, and the bubble can be said to “burst.” Alternatively, the bubble may remain present and the turbulent boundary layer may separate abruptly immediately downstream of the bubble. This is called leading edge stall by the reseparation mechanism – see Evans & Mort (1959). Because both bubble burst and reseparation result in a sudden change in the flow pattern around the airfoil, it is often difficult to discern the actual flow separation mechanism. It can usually be determined with the aid of flow visualization, which can confirm the existence of a laminar separation bubble in the post stall regime. At the Reynolds numbers of practical interest on full-scale helicopter rotors, reseparation is the common flow mechanism for leading edge stall.
The third type of static stall shown in Fig. 7.32, which is exhibited by the relatively thicker NACA 63-015 and the very thick NACA 63-021 airfoil, is called trailing edge stall. This is a fairly common stall mechanism found with the higher t/c ratios and larger camber values typical of some modem rotor airfoils, and it is caused by the relatively gradual movement of the turbulent flow separation point from the trailing edge toward the leading edge. Trailing edge stall produces a progressive rounding of lift behavior near maximum
|
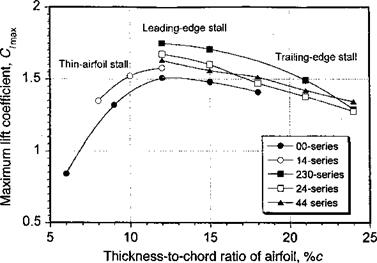
Figure 7.33 Summary of results showing combined effect of thickness and camber on C/max. Data source: Abbott & von Doenhoff (1949). |
lift with a gentle pitching moment break. Another characteristic of the trailing edge stall mechanism is that the pitching moments exhibit a pronounced nose-up tendency just prior to maximum lift. For lower t/с ratios a high value of maximum lift is still produced on airfoils that exhibit trailing edge stall, although generally not as high as for airfoils that exhibit leading edge stall. With increasing tfc, the maximum lift decreases rapidly with trailing edge separation occurring at progressively lower angles of attack. Some airfoils can experience abrupt trailing edge stall, particularly at higher Reynolds numbers, which manifest as a rapid forward movement of the trailing edge separation point and in the absence of supporting evidence, such as pressure distributions and flow visualization, can be easily confused with leading edge stall.
In light of the foregoing, it is apparent that several potential design methods can be used to increase the C/max of an airfoil. One method is simply to change the airfoil thickness, such as using a NACA 0012 over a NACA 0009. Figures 7.33 and 7.34 summarize the experimental results for the NACA airfoils. There are clearly significant advantages in using some thickness to avoid the formation of a long laminar separation bubble, but there is no substantial benefits in terms of C/max for t/c >15%, unless thicker airfoils are needed to meet blade structural requirements near the blade root. Another method is to introduce forward camber for a given airfoil thickness, such as using the NACA 23012 rather than the NACA 0012. These results are summarized in Fig. 7.34. This latter modification gives a more gradual curvature to the airfoil at the leading edge, resulting in a less adverse pressure gradient at a given AoA or lift coefficient. As shown in both Figs. 7.33 and 7.34, all of the cambered airfoils exhibit higher values of C/max compared to the symmetric NACA 00-series, but this will be at the expense of some increase in pitching moment (see Fig. 7.25).


