Power curves – propeller propulsion
An interesting and more practical way of approaching the climbing problem is by means of what are called performance curves. By estimating the power available from the engine and the power required for level flight at various speeds, we can arrive at many interesting deductions. It is largely by this method that forecasts are made of the probable performance of an aeroplane, and it is remarkable how accurate these forecasts usually prove to be.
The procedure for jet and rocket systems of propulsion is rather different because, as already mentioned, we must think in terms of thrust rather than power. They will therefore be dealt with separately, and the following discussion relates primarily to piston-engined aircraft.
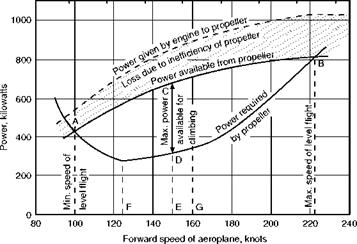
The deduction of the curve which gives the power output of the engine is outside the scope of this book, as it depends on a knowledge of the characteristics of the piston (or gas turbine) engine for a propeller-driven aircraft. From this curve must be subtracted the power which is lost through the inefficiency of the propeller (the efficiency of a good propeller at reasonable speed, but falling off on both sides depending on rpm, is about 80 per cent). The resulting curve (Fig. 7.2) shows the power which is available at various forward speeds of the aeroplane.
The power which will be required is found by estimating the drag. For this purpose the wing drag and the parasite drag are usually found separately, the former from the characteristics of the aerofoils and the latter by estimating the drag of all the various parts and summing them up. Another method of finding the total drag is by measuring the drag of a complete model in a wind tunnel and scaling up to full size. After the total drag has been found at any speed, the power is obtained by multiplying the drag by the speed, as in flying for endurance in Chapter 5, e. g. if the total drag is 4170 N at 82.4 m/s –
Power required = 4170 X 82.4 = 344 kW
And in a similar way the power required is found at other speeds, the lower curve in Fig. 7.2 illustrating a typical result. The reader may be puzzled as to
|
Forward speed of aeroplane, metres per second 50 60 70 80 90 100 110 120
|
Fig 7.2 Power available and power required why the power required increases so rapidly at low speeds; the explanation is that in order to maintain level flights at these low speeds, a very large angle of attack is required, and this results in an increase of drag in spite of the reduction in speed. If the argument sounds familiar, it is simply because we are returning to the same argument as when discussing range and endurance. The figures we have just quoted are taken from that argument, and the curve of power required in Fig. 7.2 is based on the aeroplane of Chapter 5. This followup of the same aeroplane will make the power curves more interesting and instructive.
It should be noted that there will be no fundamental difference in the shape of the power required curve for jet and propeller-driven aircraft. It is in the power available that the difference lies.


