Shell Model Test Setup
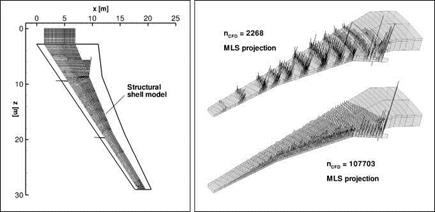
With the beam model test configuration, the different interpolation schemes and surface mesh resolutions do not produce profound local load incidence effects or major differences in the global deformation. A third test setup was investigated which bears more resemblance to a real-world configuration. The wetted surface is the HIRENASD wing scaled to a half-span of 29 m. The structural model is a shell model kindly supplied by the Institute of Aircraft Design and Lightweight Structures (IFL) of the Technical University of Braunschweig. It is akin to a modern transport aircraft wing box and has been dimensioned to real-world design loads. As such it has a realistic ratio of local sheet flexibility to total cantilever flexibility. The model is depicted in the left image of Fig. 9; a detailed description can be found in the contribution of Reich et al. in this volume. Also in this test case on wetted surfaces with varying resolutions a fictitious pressure distribution was applied. However, it cannot be exactly integrated here and thus no reference load or deformation distribution is available. In the right image of Fig. 9, the loads projected on the structure with the MLS method are depicted for the coarsest and the finest surface mesh. With decreasing number of points on the wetted surface, the absolute values of the aerodynamic surface loads increase due to the larger area of each individual surface cell. At least for the structured CFD meshes used here, simultaneously a concentration of the surface loads occurs. Potentially both can cause local load incidence effects, i. e. local “bumps” on the shell model which are then projected back to the wetted surface and might locally alter the flow field. The bumps are a
|
Fig. 9 left: Planform of the scaled HIRENASD wing and structural shell model created at the Technical University of Braunschweig. right: Comparison of the force vectors resulting from the fictitious pressure distribution on the coarsest and on the finest wetted surface and projection with MLS. |
result of the mismatch between the structural and fluid meshes; if forces rather than surface strains are projected, any such appearance must be examined: does it represent a valid structural deformation or is it merely an artifact of the spatial coupling method.
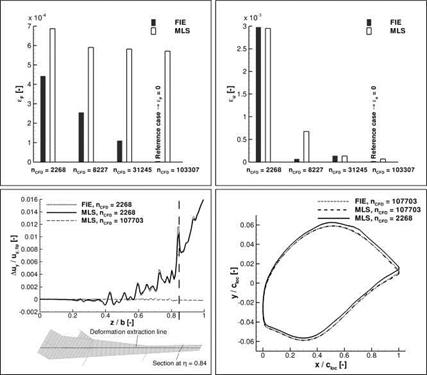
In Fig. 10 the deviations in load and deformation distributions are compared for the FIE and MLS projection and the four investigated surface meshes. No results were obtained with the GSB method owing to the high numerical effort brought about by the inversion of the RBF weights matrix C in Eq. (10). The data plotted in Fig. 10 are not be understood as absolute projection errors. The reference values do not result from exact solution, which is not available. Here, the results obtained for the surface mesh with 107703 points and the FIE method were chosen, this however does not implicitly make them the "correct” values.
In the top left diagram there is an inherent deviation visible between the load distributions obtained with the projection methods which does not decrease significantly with increasing mesh resolution. The deviations in the deformation distribution, though, are strongly dependant on the mesh resolution rather than on the projection method, as can be seen from the top right diagram. This effect can once again be attributed to the offset moments which partially compensate the differences between the load distributions. A distributed deformational deviation was extracted along a line in span-wise direction and is shown in the bottom left image of Fig. 10. The graphs for the coarsest surface mesh and projection with FIE and MLS are virtually identical. They exhibit the mentioned bumps, but also a global bending deflection higher than in the reference case. The bumps are in the order of tenths of a per cent of the total bending deflection, which for this model equates to local
|
Fig. 10 top left: RMS deviations of the forces in flap-wise bending direction according to Eq. (18). In all plots shown in this panel the finest wetted surface with 107703 nodes and FIE projection provides the reference values. top right: RMS deviations of the flap-wise bending deflections according to Eq. (19). bottom left: Local deviations of the bending deflection in flap-wise direction for the coarsest surface mesh and projection with MLS and FIE. The deflections are extracted along the length of the suction side of the wing box. Additionally the deviations with the finest surface mesh and MLS projection are shown. bottom right: Comparison of sections through the wetted surface at the spanwise position n = 0.84. |
differences in the contour of several millimetres. The difference in global deflection is in the order of one per cent. The deviations between the projection methods for the finest mesh level are also plotted. They are close to zero all along the span. For a rough assessment of the influence of the differing structural deformations on the shape of the wetted surface, in the bottom right image two sections through the wetted surface at the spanwise position n = 0.84 are superimposed, which is where the distinct peak in the deviations is visible in the bottom left image. This comparison is slightly marred by the fact that the respective projection methods are applied twice, first for the loads and again for the deflections. Nonetheless, both the difference in global deflection and a bump on the suction side are apparent for the coarsest wetted surface. It can be concluded that with thin-walled structural shell models and coarse
CFD meshes load incidence effects can indeed have an influence on results, but it is seen to diminish rapidly with the finer CFD meshes. Even though such coarse meshes are not regularly used for standard steady simulations, they still play a role in unsteady simulations and in design, where accuracy is sacrificed for the sake of solution speed. For instance during the preceding project MEGADESIGN [20], a design case was investigated using a volume CFD mesh with approximately 170000 points; 4425 points thereof made up the surface mesh.


