SLIPSTREAM EFFECTS ON TAIL SURFACES
In the design and stability analysis of the tail surfaces it is necessary to determine the flow conditions with regard to velocity and direction. The flow at the tail surfaces is effected by the wings and fuselage as discussed in Chapters XIII and XIV and can be influenced by the slipstream wash of the propulsive system. This is especially true with propeller driven airplanes as the slipstream cross section is large with respect to the airplane. This makes it nearly impossible to locate the tail surface outside the slipstream at all the flight conditions. In the case of tractor single engine propeller airplanes, the tail surface is influenced by the propeller wash at all conditions. This can be a beneficial effect, except when the airplane is operating at a large yaw angle for instance where the tail goes outside the slipstream.
Because of the higher velocities of the efflux of the ducted propeller and turbo fan engines, it is possible to locate the power plants in positions whe the exhaust flow will not directly impinge on the tail surfaces. Because of the higher velocity of the engines, their body shape and induced effects their location becomes important in the design of the tail.
In this section the influence of propulsive lift on the design and analysis of the tail surfaces will be considered.
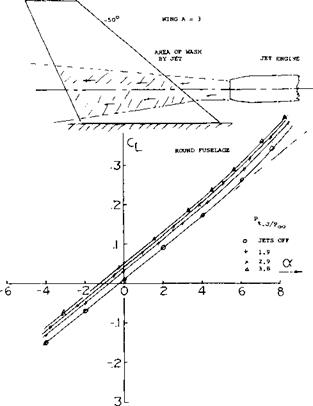
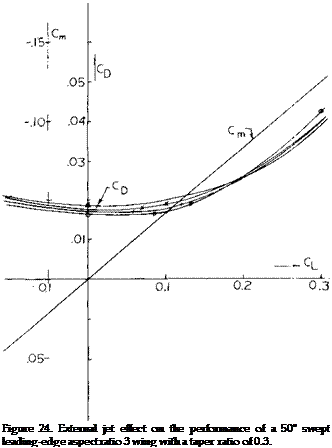
Wing Lift Interaction with External Jet. When a wing operates in the wake of jet engines a large increase in both the lift and drag coefficients would be expected due to the increased dynamic pressure in the jets. Considering only the forces on the wing the data of (10,a) indicates a nearly constant increment of CL with changes in angle of attack, figure 24. The increment changes with Mach number up M = 0.9 and increases with the engine pressure ratio. Since the jet remains fixed in relation to the wing the flow from the jet will be essentially the same relative to the wing at all angles. Thus, when the angle of attack changes, the efflux of the engine does not change relative to the wing, explaining why the increment in lift remains constant with angle.
At the lower angles of attack, the drag is increased by the efflux of the engine. When the operating CL is greater than.2 the jet exhaust on the wing causes a drag reduction due to a reduction of the induced effects. The pitching moment was not changed due to jet exhaust over the wing.
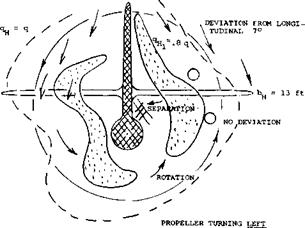
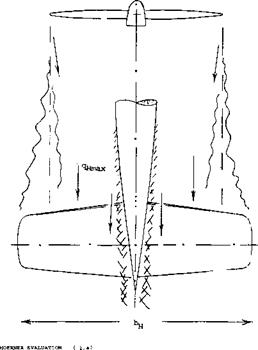
Slipstream Flow Field. The flow field at the location of the tail as affected by the slipstream of a propeller has repeatedly been mapped (11), (12) showing the distribution of direction (downwash) as well as that of the dynamic pressure. Such surveys can be extremely irregular and their study is likely to suggest that tail surfaces may never work to satisfaction within the slipstream of a propeller. As an example, one such distribution is shown schematically in figure 25. The slipstream is distorted. Behind the usual single-rotation type of propeller (in the airplane tested, turning counter-clockwise) the two sides are not symmetrical. The slipstream rotation (corresponding to torque) modified by the directing effect of the wing is displayed, both in the downwash and in the dynamic pressure concentration in certain spots. As a consequence, the average downwash is increased in the left and reduced in the right tail-surface panel of the airplane tested.
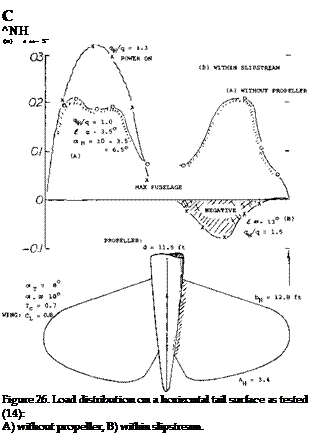
 Tail Load Distribution. The tail load distribution of the P-40 airplane (tested in the NACA’s Full-Scale Tunnel) is shown in figure 26:
1) Without the propeller and at zero angle of yaw we can expect the loading to be symmetric. The dynamic pressure ratio (outside the fuselage) is essentially qn/q = 1.0. At CL = 0.8 in the wing, the average downwash angle at the tail is £ – -6.5° so that oCH = 10 – 6.5 = 3.5°.
2) The resultant average tail force corresponds to CNW = 0.14, so that (dCN/doc)M = 0-04. This small lift curve slope reflects the strong interference of the fuselage, practically interrupting the lift in the center of the tail surface.
3) With propeller and power on, with a thrust coefficient Tc = 0.7, everything is strongly asymmetric. In particular, corresponding to a downwash angle increased to the level of 8 = —13° the lift on the right side of the horizontal surface is rendered somewhat negative. The average tail force is about half of that with the propeller off. In fact, the tail effectiveness in the power-on condition as shown would be better when taking the right side panel off completely, see (13Ді). [109]
4) When at positive angle of yaw (nose to right, tail to left) the basic wing downwash tends to be increased at the right side. However, power and slipstream of the rightturning propeller have an opposite tendency. The most severe asymmetric loading (in pounds) must be expected at high speeds (low lift coefficients) when sideslipping to the left (left wing forward). A corresponding yawing to the right usually takes place in pull-up maneuvers, caused by the gyroscopic moment of the right-turning propeller.
However irregular the distribution may be, horizontal surfaces pick up comparatively continuous normal forces, and they are not necessarily very sensitive as to local dynamic pressure variations. We will, therefore, disregard distributions at first, and we shall evaluate, consider and use the consequences of slipstream as they are integrated by the horizontal surface.
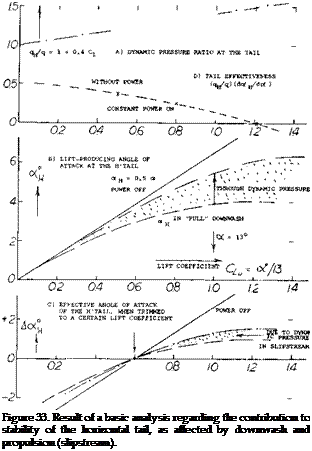
Dynamic Pressure at the Tail. The dynamic pressure within the slipstream of a propeller at the horizontal tail is theoretically
qH = q(!+Tc); qH/q = 1+Tc (26>
2
where q = 0.5 ?V = dynamic pressure corresponding to the airplane’s speed “V”. In other words, the added pressure ratio is
Aq/q = Tc (27)
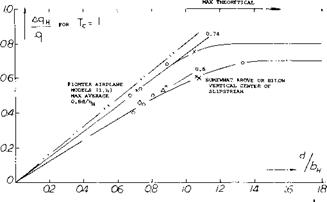
Considering a horizontal tail surface completely located within the slipstream, its reactions to variations in the angle of attack or the elevator angle would then tentatively be proportional to the ratio to q^ /q. Under realistic conditions, the influence upon the tail surface is smaller however:
1) Depending on what you call thrust (at the propeller or “net effective”) the slipstream loses some of its A q through friction along the fuselage, et cetera.
2) The slipstream mixes with the surrounding flow so that the differential indicated by equation 27 is reduced.
3) The horizontal surface may not entirely be covered by the slipstream (or by those of two or more propellers, according to configuration).
4) The distribution of the dynamic pressure across the span of the tail surface is non-uniform, as mentioned above.
5) The slipstream is limited in size. The lift in the H’tail, therefore, cannot be expected to increase “fully” in proportion to (1 + Tc) as in equation 26.
|
|
|
d/bjj = 0.75 Tc = 0.6 CL =0.5 |
Figure 25. Example for the distribution of dynamic pressure and downwash in the vicinity of the horizontal tail of a single-engine airplane.
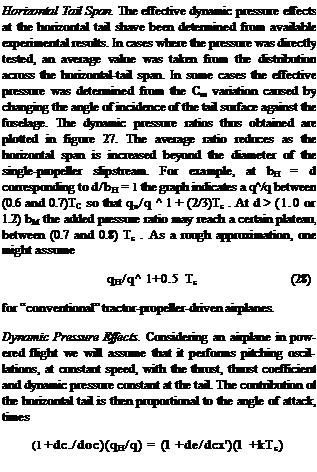
where к = .5 as possibly as in equation (28). For example, at CLoC = 1, Tc = 1 for к = 0.5 and dt/doc = —0.4, we may expect to have a tail effectiveness, corresponding to 0.6 (1.5) = 0.09 = constant. However, the airplane is likely to change speed during its pitching motions. Neither q H/q nor downwash and a number of forces and moments depending upon the thrust coefficient are, therefore, constant when considering the “static” derivative dCm/dCL.
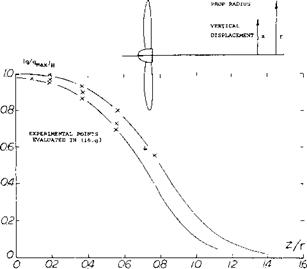
Vertical Variation. The evaluation above is based upon the condition that the horizontal tail is really “in” the slipstream, as far as vertical location is concerned. Dynamic pressure ratios are plotted in figure 28 versus the vertical displacement z, above or below the “center” of the slipstream at the location of the tail. The function found might be expressed by
q H /q = cosn where 9°- к (z/r)m
where k, m and n are suitable constants. In the form as interpreted, a maximum value of
d(qH/q)/d(z/r) = -2 (29)
 |
might be encountered when “leaving” the slipstream area due to the loading distribution on the propeller blade.
|
X ARC FIGHTERS MODELS (10,b) £> AVA AIRPLANE MODELS (17, d) 0 FROM OTHER SOURCES (TR 941) |
|
Figure 27. Mean dynamic pressure ratio at the horizontal tail located across the slipstream of singe-engine airplane configurations. |
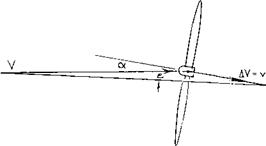
Downwash Angle. The downwash angle is generally t = w/V, where w = downward velocity imparted by the wing. After adding propeller and slipstream both the downwash velocity (w) and the longitudinal velocity (V) are increased, so that
£ = (w + Д w)/(V + v) (30)
where w and t – negative, and v = increment of V. Directly behind the trailing edge of a wing the downwash angle can be expected to be the same as without the slipstream (£~ — oC ). Subsequently, the slipstream tends
|
Figure 28. Variation of the average dynamic pressure across the slipstream, at the location of the horizontal tail, as a function of vertical displacement from the “center”. |
to keep that direction, so that its angle is not reduced as much as the downwash sheet. In fact, the slipstream may be expected to be directed downward at least as much as that of an isolated slipstream or jet. As illustrated in figure 29, the downwash at “some” distance behind such a propeller, is theoretically w = -v cxf, so that the angle corresponds to
6/<x – —v/(V + v)
=-( vt+f; – о/ /1+tc
= -(1 -(1/ Vl + TJ) (31)
20
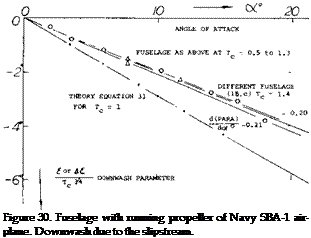
The fuselage of an airplane was tested (15,g) with operating propeller in front, but without the wing. As plotted in figure 30, the resultant average downwash angle in the slipstream at the location of the tail can be expressed by
<5 = -0.21 (X (32)
where the % power produces a function similar in character to that in equation (31). For example, at Tc =1, that equation yields £/<x ~ —0.29. Momentum is evidently lost in the slipstream through dissipation and by way of friction along the fuselage. A similar investigation of a fuselage plus propeller, but no wing, in (16,c) shows downwash angles around 80% of the theoretical expectation.
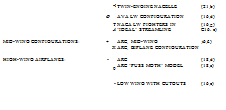
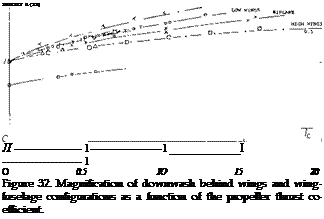
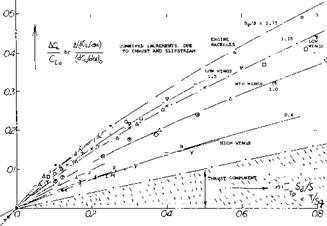
Fuselage + Wing + Propeller. When adding a propeller operating at zero thrust to a fuselage-wing combination, it is quite often found that C ^ as in figure 31 and AE as in figure 32 are both higher (by a few%) than without the propeller. It is also possible that the down wash angle increases at a rate higher than indicated by equation (33) over a small range of the thrust coefficient. The flow pattern along the wing roots (or along the engine nacelles) becomes evidently improved by the slipstream (mixing, turbulence, energy). It seems to be necessary, however, that there is a flow separation first, before the slipstream can have this effect. — Average down wash angles, evaluated from distributions at the location of the horizontal surface or as integrated by the tail, are plotted in figure 32. For an average value of d£0 = —0.5 da’, (as in wings with A in the order of 6, at the usual location of the horizontal tail) equation (31) changes into
btlt0 =2-21 l/T+Tc (33)
The experimental points plotted in this form are between 0.5 and 0.8 of the theoretical expectation. Again, there are evidently losses in the slipstream this time also along the wing roots. One reason for the spread in the graph is the wing plan form. In comparison to a tapered wing, a rectangular wing has only some 75% of the downwash in its center plane. When adding the propeller slipstream, therefore, the ratio E І£0 must be expected to be higher in the rectangular and smaller in highly tapered wings.
W = 6000 lb
P = 1000 HP
d = 9 ft
S = 260 ft2
 jrr^ r^v
![]()
|
DOWNWASH COMPONENT w = – v of DOWNWASH ANGLE £ = w/(V + v) |
Figure 29. Downwash produced by a propeller; see (15,b). Example for a = 10°, Tc =1 and v/V = 0.4. The resulting downwash angle is theoretically £ = —2.9°. [110] [111] [112]
Wing Roots. It is explained in the preceding chapter how most fillets increase, and that cut-outs reduce the down – wash derivative at the location of the tail. Downwash angles tested behind the cut-out configuration as in figure 33 of the first chapter on “longitudinal stability” are included (o ) in figure 32. It is seen that the downwash is reduced to 70% of that of the original complete wing (denoted by £0 ). When adding the propeller slipstream it seems that the 70% ratio is maintained (70% of the increasing function). Cut-outs should, therefore, be very effective in regard to stability. Since the propeller more than replaces the lift that is likely to be lost on account of the cut-away wing chord, not much of a deterioration of performance may be expected. On the other hand, wing – root fillets leading to increased downwash derivatives must be considered to be detrimental to longitudinal stability, particularly when in the slipstream.
(14) Sweberg, Horizontal Tail Load Distribution, NACA W’Rpt L-227 (1944).
(15) Flow field behind twin-engine nacelles:
a) Stiess, Do-17 in Flight, Ybk D Lufo 1938 p 1-206.
b) Schmidt, Do-17 in Flight, Ybk D Lufo 1941 p 1-443.
c) In 2- and 4-engine pusher configurations, see (ll, c).
Jet Propulsion. Jets originating from engines mounted in the wing can also be expected to have some effect upon the flow conditions at the horizontal tail. In the example of a twin-engine airplane as in figure 34, each jet produces some 1500 lbs of thrust through an outlet (nozzle) area of not more than 1.2 ft2. In climb condition, the corresponding thrust coefficient (on outlet area) is in the order of Tc = 30, which is more than 30 times what a conventional propeller would have in the same flight condition.
|
Л |
AVA |
HS-124 TWIN ENGINES 2 Sd/S = |
0.35 (21,1?) |
|
• |
NACA |
MW NACELLE WITH Sp/S = 0.17 |
(20,a) |
|
0 |
NACA |
TWIN ENGINES MID-WING |
(22,f) |
|
a |
NACA |
TWIN ENGINES 2 Sp/S = 0.33 |
(20,b) |
|
X |
NACA |
B-28 TWIN ENGINES |
(22,c) |
|
Y |
ARC MID-WING NACELLE |
(6, c) |
|
|
» |
NACA |
NACELLE MID-WING |
(20,a) |
|
© |
NACA |
4-UNDERSLUNG NACELLES |
(23,h) |
|
– |
AVA WING PLUS MW PROPELLER, 0.21 |
(16,a) |
|
a) WING-NACELLE COMBINATIONS |
|
b) LOW-WING CONFIGURATIONS: A NACA PURSUIT W’ S /S = 0.38 (l, b) V NACA No. 12/13 FiBhTER, z/c = 0.1 (l, b)(13,d) + ARC "SPITEFUL" WITH Sp/S =0.48 (13,b) A He-70 AND Me-109 AIRPLANES (.19, b) II NACA PURSUIT AIRPLANE Rc = 5(10)5 (13,c) c) MID-WING CONFIGURATIONS: 0 ARC WITH PROPELLERS 3 Sd/S =0.74 (6,d) H ARC A = 6, d/c = 1.34, CLq = 0.6 (6,a) = NACA WITHOUT TAIL, Sp/S = 0.35 (13, a) |
![]()
![]()
![]()
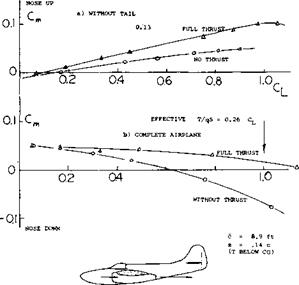
 Downwash Due to Jet. Strong jets as described above may have a downwash practically equal to their angle of attack, t = -<x. In comparison to the slipstream of a propeller, the size (diameter) of a jet is small, however. The combined cross-sectional area (2.4 ft2) of the two jets in figure 34 is not more than 3.5% of the horizontal tail area (69 ft2). By comparison of the pitching moments with and without tail and thrust, respectively, it is found in the graph that the downwash angle variation dt/dC^ or da /dec is increased by jet action between 30 and 40%. Qualitatively this result may be explained by spreading the downwash momentum of the jets over a cross-section area equal to that of the horizontal tail. For CL =0.6, where Tc = 30, we may then obtain, for 2 Sj/S = 0.035.
A tie = 0.4 (30)0.035 ~40%
where “0.4” is assumed to be the Д (d£/dcx:) in the original jet as against the downwash ratio behind the wing at zero thrust. This analysis should be refined by introducing Tc~ C L, and A t – f(Tc ). A physical explanation for the influence of the jets upon downwash at the level of the horizontal tail is their dissipation, the transfer of momentum through mixing, upon the surrounding flow.
(17) High-wing, low-propeller airplane configurations:
a) See several German airplane designs in (18,a).
b) Millikan, Lockheed “Vega”, J A Sci 3 (1936) p 79.
c) Hagerman, Single Engine, NACA TN 1339 (1947); for lateral characteristics of same configuration, see TN 1379.
d) Bryant-Williams, “Puss Moth”, ARC RM 1687 (1936).
e) Avion “W”, Serv Tech Aeronautique (Brussels) Bull 15 (1935).
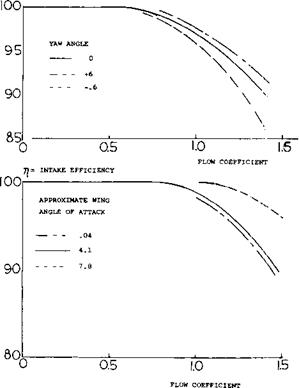
 Aft Mounted Engine Tail Interference. Rear mounted engines will influence the longitudinal stability of aircraft due to the flow induced on the tail surfaces by the lift of the engines and their supporting structure, by their thrust line orientation with respect to the eg and by interference effects. The aft location of the engine can also be important with regard to the flow interference of the wing on the intake air of the engine. This is illustrated on figure 35 for typical aircraft with aft mounted engines as a function of angle of attack and yaw angle for a range of the flow coefficients (16,e).
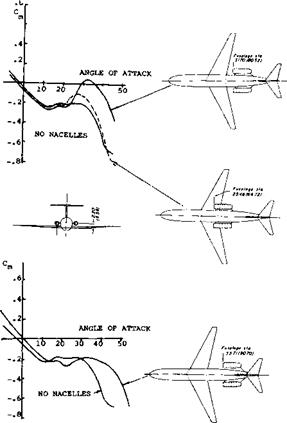
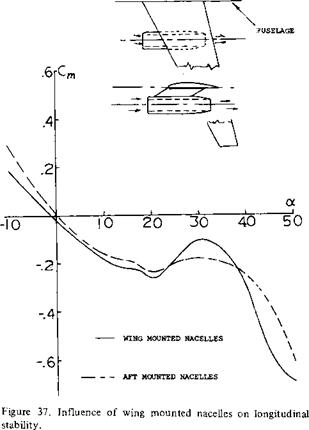
The lifting forces of aft mounted jet engines, including induced and interference effects, will effect the aircraft stability and the tail design. This is illustrated in (16,a) where the placement of aft mounted engines on a transport type airplane is investigated. As might be expected, the nacelles located furthest aft generally have the most favorable effect on longitudinal stability, especially at the higher angles of attack, figure 36. This result is expected on the basis of the lift produced by the engine nacelles and their interference effects on the horizontal tail. When the engines are mounted forward on the airplane, it will be noted from figure 36 that a destabilizing moment is produced when the angle of attack is above 20 degrees. At this condition the wake of the flow across the engine nacelles is spoiling the lift of the horizontal tail, thus reducing the stability.
Jet Engine Effects on Tail Surfaces. Although the efflux produced by jet engines does not impinge directly on the horizontal and vertical tail surfaces, their location influences the flow at these surfaces (16,a). The level of interference produced by the engines depends on their location, thrust, wing lift augmentation and flight speed. The engine location and orientation with respect to the aircraft eg influences the directional and longitudinal stability due to the thrust moment arms. For instance, the engine out yawing moment of tail mounted engines is generally less than for aircraft with wing mounted engines due to the reduced moment arm. This is especially true for typical four engine transport aircraft as compared with aft mounted two engine aircraft. [113] [114]
|
TWIN-JETS AT FUSELAGE SIDES, 1.2 ft2 OUTLET EACH W – 10,000 lb; CG AT 27% MAC T = 0.28 W = RATED, EFFECTIVE THRUST T = 2(1650) lb = MAXIMUM AT SEA LEVEL b = 45.5 ft. Ьд = 17 ft S 385 ft.2; Sjj/S = 18 % WING SECTIONS 66-014 AND 66-212 |
Figure 34. Bell P-59 first U. S. jet-propelled fighter (around 1943) as tested (16,b) in the Full-Scale Tunnel.
|
|
|
|
Engine-Nacelle-Fuselage Integration. The fuselage nacelle combination can be designed to eliminate interference effects and prevent separation on the cowl by using a coke bottle type contour. Test (23) indicates the axial force can be reduced to just the added skin friction of the engine cowl skin friction. This is accomplished with a thin NACA-1 series cowl which gives a favorable interference effect that more than cancelled out the nacelle pressure drag. Very high drag Mach numbers (0.97) are achieved with such a design.
(19) Engine nacelles with propellers:
a) Wood, Combinations, NACA T Rpts 415, 436, 462 (1932/33).
b) Kuhn, Wing-Propeller Combination, NACA T Rpt 1263 (1956). [115]
(21) Investigation of twin-engine airplanes:
a) Hoerner, Longitudinal Stability of Ju-288 Bomber in the DVL Wind Tunnel, Junkers Rpt Kobu-EW, 18 March 1941.
b) Rogallo, NA B-28 Stability, NACA W Rpt L-295 (1943).
c) Johnson, Lockheed “Electra”, J A Sci 1935/36 p 1.
d) Weiberg, Transport Airplane, NACA TN 4365 (1958).
e) Sweberg, Twin Engine, NACA W Rpt L-425 (1942).
0 Bryant, Longitudinal Stability, ARC RM 2310 (1940).
g) Morris, Analysis of Flight Tests, ARC RM 2701 (1953).
(22) Investigation of 4-engine airplanes:
a) Mathews, Boeing B-29, NACA TN 2238, T Rpt 1076 (1952).
b) Weiberg, Transport Airplane, NASA TN D-25 (1959).
c) Cowley, Armstrong-Whitworth 4 Engines, ARC RM 1624 (1933).
d) Edwards, 4-Engine Swept Wing, NACA TN 3789 (1953/6).
(23) Blaka, Aft Engine Nacelles for M=0.6 to 1.0, NASA TMX-3178.
12-24
Slipstream Effects of Wing Mounted Engines. As with aft mounted engines, the induced and interference effects of wing mounted engines will influence the flow at the tail surfaces and thus the stability. This is illustrated on figure 3 7; which shows the destabilizing moment curve of wing mounted nacelles when operating at angles above 20 .
With wing mounted nacelles arranged to produce high levels of lift augmentation, the size and location of the horizontal tail becomes critical as is discussed in (8,a). The high lift augmentation ©f the wing by the engine will result in high downwash angles at the normal horizontal tail location, which reduces the longitudinal stability. By moving the horizontal forward to a region outside the wake, the stability problem can be overcome.
An investigation was made of the effects of the engine located at the wing tip (16,f). In this case the engine is used to counter the tip vortex of the wing and thus improve the drag in a manner similar to tip tanks. The interference drag of other engine locations are covered for the larger fan jet engines, such as (16,g.).
|
(24) Section lift as influenced by rotation a) Hemmelskamp, Tests of sections on a propeller, Gottingen, Rep. No. 2, 1950. b) Baskin et al, Theory of the lifting airscrew, NASA TT F-823 c) Schlichting, Boundary layer theory, McGraw Hill 1979 d) Stepniewski, Rotary Wing Aerodynamics, NASA CR 3082 |


