STATISTICAL ASPECTS OF DYNAMIC-STRESS PROBLEMS
In the preceding section the response of an airplane to a specific gust is discussed. In applying such an analysis to the practical design of an aircraft, we must know how to specify the gust profile.
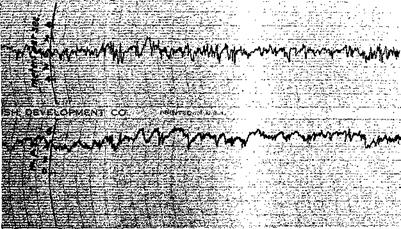
Figure 8.6 shows a record of vertical gusts measured by a hot-wire anemometer carried on a stationary balloon (fastened to the ground by wires) 146 meters above the ground.[22] It is similar in nature to the anemometer records of wind-tunnel turbulences. From such a figure it is indeed impossible to say what kind of an isolated gust profile can characterize the real picture.
Similar difficulty arises in other dynamic-stress problems. In fact, one of the most difficult problems in structural design with regard to transient loads is the determination of the forcing function, or the selection, among
|
Fig. 8.6. A gust record. (Courtesy of Dr. P. MacCready of the California Institute of Technology.) |
the great variety of possible forcing functions, of those to be used as a basis for design. The exact form of the forcing function is always uncertain to some extent because of the large number of variables entering the problem. Thus, when a few important variables are considered in a calculation, other variables appear as disturbing influences. The rartdom nature of the atmospheric turbulence as shown in the records of Fig. 8.6 are due to the influences of the viscosity, pressure, density, temperature, and humidity of the air and the initial velocity distributions, varying in such a complicated manner that a mechanistic prediction based on the hydrodynamic equations is practically impossible.
If the uncertainty of predicting the forcing function is recognized, the problem becomes statistical. One then tries to state the main features of the response, as well as those of the forcing function, in terms of
statistical averages and probability distributions. The statistical terminology will first be explained in the next three sections. The “gust” response of an airplane, to a continuous atmospheric turbulence such as the one recorded in Fig. 8.6, is then calculated.


