FLIGHT PATHS IN THE CHARACTERISTIC MODES
Additional insight into the modes is gained by studying the flight path. With the atmosphere at rest, the differential equations for the position of the C. G. in Fe are given by (5.13,19), with ye = 0, i. e.
Dxf = 1 – f – Д V
Dze = —(Д0 — Д«) (9-1,2)
In a characteristic oscillatory mode with eigenvalues A, A* the variations of ДТ, AO, and Да are [cf. (3.3,30)]
AV — и13е1 + и*/ *
Да = u2jeli + и*/*1 (9.1,3)
АО = щ3еи + и*3е1*1
where the constants ui} are the components of the eigenvector corresponding to A. For the previous numerical example, they are the complex numbers given in Table 9.2 with j — 1 for the phugoid and j = 3 for the short-period mode. After substituting (9.1,3) in (9.1,2) and integrating we get
 |
|
&E = * + НГ eU + JTe ^ + COnst
where Re denotes the real part of the complex number in the square brackets. The dimensional coordinates are obtained by using the additional relations
xE — — xE, zE — — iE, t — t*t (9.1,5)
^ z
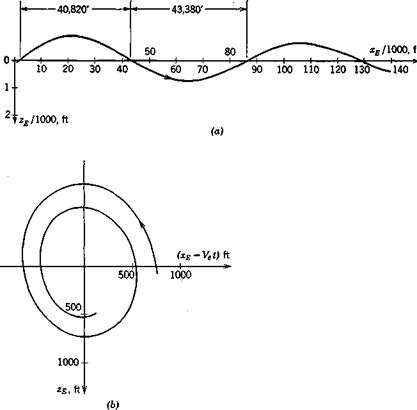
For the numerical data of the above example (9.1,4) and (9.1,5) have been used to calculate the flight paths in the two modes, plotted in Fig. 9.3. The magnitudes of the eigenvectors were chosen so that 0max is approximately 4° in the phugoid mode, and 10° in the short-period mode, t = 0 corresponds to the configuration of variables in Fig. 9.2, and the arbitrary constants of
(9.1,4) are zero. The latter choice makes the initial point of the flight paths differ from the origin, but they both approach the xE axis as t —> сю. Figure 9.3a shows that the phugoid is an undulating flight of very long wavelength.

|

Since Да = 0, the vehicle “flies like an arrow,” i. e. has its x axis approximately tangent to the trajectory. The mode diagram, Fig. 9.2a shows that the speed leads the pitch angle by about 90°, from which we can infer that V is largest at the bottom of the wave and least at the top. This variation in speed results in different distances being traversed during the upper and lower halves of the cycle, as shown in Fig. 9.3a. For larger amplitude oscillations, this lack of symmetry in the oscillation becomes much more pronounced (although the linear theory then fails to describe it accurately) until ultimately the upper part becomes first a cusp and then a loop (see Miele, ref. 1.7, p. 273). The motion (see Sec. 9.2) is approximately one of constant total energy, the rising and falling corresponding to an exchange between kinetic and potential energy. Figure 9.36 shows the phugoid motion relative to axes moving at the reference speed Ve. This is the relative path that would be seen by an observer flying alongside at speed Ve.
Figure 9.3c shows the path for the short-period mode. The disturbance is so rapidly damped that the transient has virtually disappeared within 1000 ft of flight, even though the initial Да and Д6 were very large. The deviation of the path from a straight line is small, the principal feature of the motion being the rapid rotation in pitch.


