Our heavyweight helicopter equal in the world does not have
In Rostov started production of the most load-lifting rotary-wing car The Russian holding «Helicopt[...]

Everything about aircrafts and helicopters. News and events in aviation worldwide. Civil, transportation, military helicopters and airplanes.

Everything about aircrafts and helicopters. News and events in aviation worldwide. Civil, transportation, military helicopters and airplanes.

Everything about aircrafts and helicopters. News and events in aviation worldwide. Civil, transportation, military helicopters and airplanes.

Everything about aircrafts and helicopters. News and events in aviation worldwide. Civil, transportation, military helicopters and airplanes.


Computation of the velocity distribution on the profile contour The general case of a cambered profile of finite thickness will now be treated, after the case of the very thin profile (skeleton) discussed in Sec. 2-4-2 and the case of the symmetric profile of finite thickness in chord-parallel flow discussed in Sec. 24-3. The general case is obtained essentially by superposition of these two previously discussed cases.
A cambered profile of finite thickness can be composed of a skeleton line Z(s) = z^/c and a teardrop profile Z^ — z^jc (Fig. 2-1). In Eq. (2-1), the profile ordinates are given as
![]() zUil = z^±zW
zUil = z^±zW
where the upper sign is valid on the upper surface, the lower sign on the lower surface. With Zu, the ordinates on the upper surface, and Zh those on the lower surface, Eq. (2-108) can be broken down into
![]() ^ = I (Zu + Z,) and z<*> = І (Zu – Zi)
^ = I (Zu + Z,) and z<*> = І (Zu – Zi)
The velocity distribution of the general profile is the sum of those of skeleton and teardrop. A third distribution has to be added, however, which is produced through the inclination of the teardrop profile. Riegels [49] computed this contribution. The velocity contribution caused by the inclination of the teardrop profile may be interpreted as the influence of an additional camber and an
|
1(1-Z) (*Щ |
additional angle of attack, as was shown in [68]. Accordingly, the following contributions have to be added to the geometric skeleton (mean camber) line Z^:
^ = -2“(^).V-0 (2’U№)
The equations for the computation of velocity distribution and aerodynamic coefficients that were derived by the method of singularities in the cases of skeleton and teardrop profiles can be evaluated conveniently through numerical quadrature formulas. Details for the computations are found in [49].
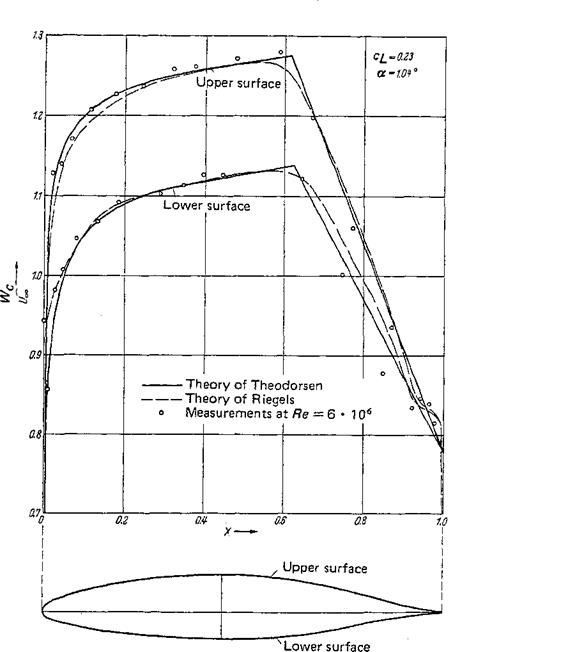
The result of a sample computation from the above outlined method for the computation of velocity distributions on profiles is presented in Fig. 2-35 for the profile NACA 66 (215)-216, a — 0.6. A theoretical velocity distribution from Theodorsen and Garrick [66] (conformal mapping) is also shown, and for comparison with the theory, a measurement from [1] is added. The agreement of the two theoretical curves with the test data is good. Note the appreciable agreement of these pressure distributions for the inclined symmetric Joukowsky profile, obtained by the method of singularities, with those of Fig. 2-16, computed by the method of conformal mapping.
Lift and pitching moment The computation of the aerodynamic coefficients for the skeleton profile was discussed in Sec. 24-2. The results in that section are also valid for the inclined profile of finite thickness if the influence that is introduced by the inclination of the teardrop profile in Eq. (2-110) is taken into account. The resulting relationships for lift slope and neutral-point location are given in Table 2-1.
The other aerodynamic coefficients (zero-lift angle of attack, zero-moment coefficient, angle of attack, and lift coefficient of the smooth leading-edge flow) are equal for the profile of finite thickness and the skeleton profile.
For the Joukowsky profile in Eq. (2-100) the lift slope is
………………………………….. – 2rr(l………….. – b e) = .2zt(l – 0.77 <5)………. _ . (2-11 la)
da
(24Ш)
in agreement with the solution from the method of conformal mapping, Eq. (2-33).
For the NACA profiles of Fig. 2-2, these formulas show that the lift slope always increases with thickness, whereas the neutral point lies behind the c/4 station of the profile. The test data of the lift slope from [1] lie in all cases below the theoretical values. When the profile thickness increases, the lift slope of the older NACA 00-series with a relatively large trailing-edge angle decrease’s (Fig. 2-2b), whereas it shows the theoretical trend in the newer NACA 6-series with a smaller trading-edge angle (Fig. 2-2c). In ah cases, the lift slope is smaller when the surface
|
Figure 2-35 Velocity distribution on the profile contour of profile NACA 66 (215)-216, a — 0.6. Lift coefficient c£ = 0.23. Comparison of theory and experiment. |
is rough than when it is smooth. This behavior shah be taken up again in Sec. 2-5. A similar comparison shows disagreement of measurement and theory for the neutral-point location of the older NACA series.
Using a procedure by Martensen [28], Jacob [28] extends the singularities method by arranging vortices on the profile contour instead of the profile chord. The investigation of Lan [37] and the comments by Maskew and Woodward [40] should be mentioned. Furthermore, profile theories of higher order for incompressible flow are found in, among others, Keune [22, 32] and Lighthill [39]. An – essential contribution to the theoretical and experimental investigations of fluid mechanical behavior behind blunt profiles has been made by Tanner [65]. Base pressure and base drag play an important role in this case.