Pressure Uncertainty Analysis for Subsonic Airfoil Flows
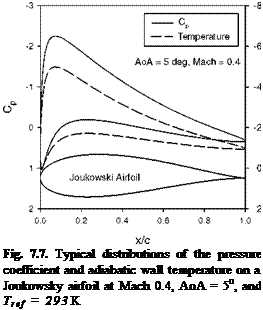 |
PSP measurements on a Joukowsky airfoil in subsonic flows are simulated in order to illustrate how to estimate the elemental errors and the total uncertainty using the techniques described above. The airfoil and incompressible potential flows around it are generated using the Joukowsky transform; the pressure coefficients Cp on the airfoil in the corresponding subsonic compressible flows are obtained using the Karman-Tsien rule. Figure 7.7 shows typical distributions of the pressure coefficient and adiabatic wall temperature on a Joukowsky airfoil at Mach 0.4 and AoA = 5o.
Presumably, PSP, Bath Ruth + silica-gel in GE RTV 118, is used, which has the Stern-Volmer coefficients A(T) ~ 0.13[1 + 2.82(T – Tref )/Tref ] and
B(T) ~ 0.87[1 + 4.32(T – Tref)/Tref] over a temperature range of 293-333 K.
The uncertainties in a priori PSP calibration are AA/A = AB/B = 1% . We assume that the spatial changes of the paint thickness and dye concentration in the image plane are 0.5%/pixel and 0.1%/pixel, respectively. The rate of photodegradation of the paint is 0.5%/hour for a given excitation level and the exposure time of the paint is 60 seconds between the wind-off and wind-on images. The rate of reduction of the luminescent intensity due to dust/oil sedimentation on the surface is assumed to be 0.5%/hour.
In an object-space coordinate system whose origin is located at the leading edge of the airfoil, four light sources for illuminating PSP are placed at the locations Xs1 = (- c,3c), Xs2 = (2c,3c), Xs3 = (- c, – 3c), and X4 = (2c, – 3c),
where c is the chord of the airfoil. For the light sources with unit strength, the illumination flux distributions on the upper and lower surfaces are, respectively,
where Xup and Xhw are the coordinates of the upper and lower surfaces of the
airfoil, respectively. The temporal variation of irradiance of these lights is assumed to be 1%/hour. It is also assumed that the spectral leakage of optical filters for the lights and cameras is 0.3%. Two cameras, viewing the upper surface and lower surface respectively, are located at (c/2,4c) and (c/2,-4c).
The pressure uncertainty associated with the photon shot noise can be estimated by using Eq. (7.5). Assume that the full-well capacity of (npe )max = 350,000
electrons of a CCD camera is utilized. The numbers of photoelectrons collected in a CCD camera are mainly proportional to the distribution of the illumination field on the model surface. Thus, the photoelectrons on the upper and lower surfaces
are estimated by ( npe )up = ( npe )max ( q0 )up / max[( q0 )up ] and (npe )low = (npe )mx (q0 )low / max[( q0 )ш ] . Combination of these estimates with
Eq. (7.5) gives the shot-noise-generated pressure uncertainty distributions on the surfaces.
Movement of the airfoil produced by aerodynamic loads is expressed by a superposition of a local rotation (twist) and translation. A transformation between the non-moved and moved surface coordinates X = (X, Y)T and X’ = (X’,Y’ )T is X’ = R( 0twist )X + T, where R(0twis,) is the rotation matrix, 0twist is the local wing twist, and T is the translation vector. Here, for 0twist = -1o and T = (0.001c, 0.01c )T, the uncertainty in q0(X)/q0ref(X’) is estimated by
var[q0(X )/q0ref(X’)] ~(q0ref )~21(Vq0)• (AX )|2, where the displacement vector is AX = X’ – X. The pressure variance associated with mapping PSP data onto a rigid body grid without correcting the model deformation is estimated by
var(p)=|( Vp)surf • (AX )mif , where (Vp)surf is the pressure gradient on the surface and (AX)surf = (X’ – X)surf is the component of the displacement vector projected on the surface.
To estimate the temperature effect of PSP, an adiabatic model is considered at which the wall temperature Taw is given by
TJT0 = [1 + r(Y-1)M2/2][1 + (y-1)M2/2] -1,
where the recovery factor is r = 0.843 for a laminar boundary layer. Assuming that the reference temperature Tref equals to the total temperature T0 = 293 K, we
can calculate a temperature difference AT = Taw – Tref between the wind-on and
wind-off cases. The adiabatic wall is the most severe case for PSP measurements since the surface temperature on a metallic model is much lower than the adiabatic wall temperature due to heat conduction to the model.
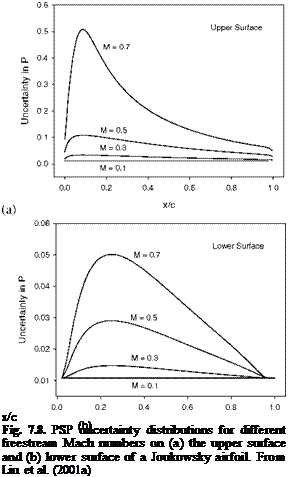
The total uncertainty in pressure is estimated by substituting all the estimated elemental errors into Eq. (7.3). Figure 7.8 shows the pressure uncertainty distributions on the upper and lower surfaces of the airfoil for different freestream Mach numbers. It is indicated that the temperature effect of PSP dominates the uncertainty of PSP measurements on an adiabatic wall. The uncertainty becomes larger and larger as the Mach number increases because the adiabatic wall temperature increases. The local pressure uncertainty on the upper surface is as high as 50% at one location for Mach 0.7, which is caused by a local surface temperature change of about 6oC.
In order to compare the PSP uncertainty with the pressure variation on the airfoil, a maximum relative pressure variation on the airfoil is defined as
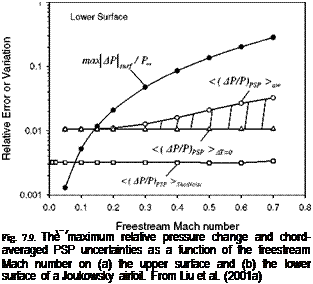
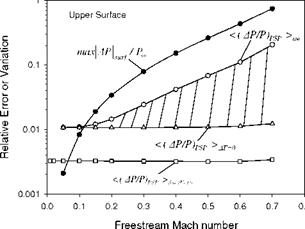
maxMSur/p™ = 0.5YMI ma^ACp. Figure 7.9 shows the maximum relative pressure variation max^psurf/p^ along with the chord-averaged PSP uncertainty < (Ap/p)PSP >aw on the adiabatic airfoil at the Mach numbers of 0.050.7. The uncertainty < (Ap/p)PSP >AT=0 without the temperature effect is also plotted in Fig. 7.10, which is mainly dominated by the a priori PSP calibration error AB/B = 1% in this case. The curves max|dpsurf/p™ , < (dp/p)PSP >aw and
< (Ap/p)PSP >AT=0 intersect near Mach 0.1. When the PSP uncertainty exceeds the maximum pressure variation on the airfoil, the pressure distribution on the airfoil cannot be quantitatively measured by PSP. As shown in Fig. 7.9, because a temperature change on a non-adiabatic wall is smaller, the PSP uncertainty for a real wind tunnel model generally falls into the shadowed region confined by
<(Ap/p)psp > aw and <(Ap/p)PSP > AT=0.
The PSP uncertainty associated with the photon shot noise
< (Ap/p)PSP >ShotNoise is also plotted in Fig. 7.9. The intersection between
max^pLrf/p™ and <(Ap/p)PSP >SholNoise gives the limiting low Mach number
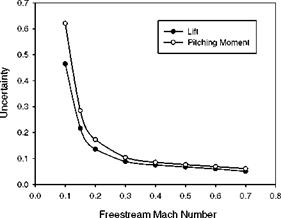
(~ 0.06 ) for PSP measurements in this case. The uncertainties in the lift (FL) and pitching moment (Mc) are also calculated from the PSP uncertainty distribution on the surface. Figure 7.10 shows the uncertainties in the lift and pitching moment relative to the leading edge for the Joukowsky airfoil over a range of the Mach numbers when the angle of attack is 4o. The uncertainties in the lift and moment decrease monotonously as the Mach number increases since the absolute values of the lift and moment rapidly increase with the Mach number.
![]()
|
|
 |
|
Fig. 7.10. Uncertainties in the lift and pitching moment of a Joukowsky airfoil as a function of the freestream Mach number. From Liu et al. (2001a) |


