Pressure Response and Optimum Thickness
Schairer (2002) studied the pressure response of PSP based on the solution Eq. (8.11) of the diffusion equation given by Mosharov et al. (1997). In a simpler notation, the luminescent intensity integrated over a paint layer is expressed as
where в is the extinction coefficient for the excitation light, C is a proportional constant, and a and k are the coefficients. In the quasi-steady case, the indicated pressure by PSP is
Ppsp(J) = [If/I(t) – A] / B, (8.15)
where the Stern-Volmer coefficients are determined from steady-state calibration of PSP. As shown in Eq. (8.15) coupled with Eqs. (8.11), (8.12) and (8.14), the indicated pressure pPSP(t) is a non-linear function of the true pressure that sinusoidally varies with time, p(t) = p0 + p1 sin( cot), although the diffusion equation is linear. However, if the amplitude of the unsteady pressure is small compared to the mean pressure (p1 << p0), the PSP response can be linearized and it is given by
pPSP(t) = p0PSP + p1PSP sin( ot + ф) (8 16)
= P0 + P1[a( y)sin( ot) + в( y)cos( ot)]’
where
 |
||
The quantity S = eh/ln(10) represents the optical thickness of the paint layer. The unsteady amplitude ratio and phase shift are given by
P1rsp/P1 =a + в2
ф = tan-1(в/a). (8.18)
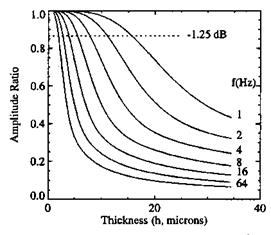
Figure 8.1 shows the attenuated amplitude ratio p1PSP / p1 at different frequencies for S/h = 0.01 qm-1 and Dm = 103 qm2/s.
The paint thickness affects both the frequency response and the signal-to-noise ratio (SNR) of PSP. As the thickness increases, the luminescent signal from PSP and thus the SNR increase, whereas the frequency response of PSP decreases as a result of the attenuation of the unsteady amplitude ratio. Hence, there exists an optimum thickness that balances the two conflicting requirements to achieve both high frequency response and SNR. Considering the unsteady luminescent signal I(t) = I0 +11 sin( at), Schairer (2002) introduced the unsteady signal amplitude
11 = Ig-Ja2 + в2 and then the unsteady SNR, SNR’ = 11 a2 + в2 .
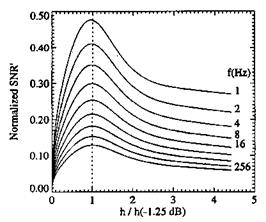
Figure 8.2 shows the normalized SNR’ as a function of the relative thickness h/h(-1.25dB), where h(-1.25dB) is the thickness that corresponds to 1.25dB (P1PSP / P1 = 0.866 ) attenuation of the unsteady amplitude ratio as illustrated in Fig. 8.1. Thus, an empirical estimate for the optimum thickness is hop / h(-1.25dB) ~ 1 that corresponds to the maximum value of the normalized
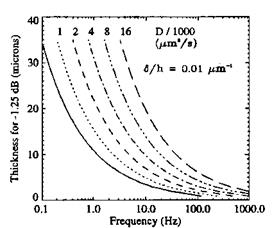
SNR’. As shown in Fig. 8.3, the optimum thickness hop ~ h(-1.25dB) decreases with the unsteady pressure frequency for a given diffusivity and relative optical thickness. Figure 8.3 indicates that the optimum thickness is less than 5 |jm for Dm < 16x 103 qm2/s when the pressure frequency is 100 Hz. For such a thin
paint layer, the absolute SNR ( ) is so low that accurate measurement of the
luminescent emission becomes difficult. This indicates that a conventional polymer-based PSP is not suitable to unsteady measurements.
When an unsteady pressure variation is no longer small, the non-linear effect of PSP response is appreciable, and the waveform of the PSP signal is distorted. In this case, recovery of the true unsteady pressure from the distorted signal is nontrivial. Assuming that the oxygen concentration is uniform across a thin paint layer, we substitute pPSP(t) = p = [O2]S^1ф0 into Eq. (8.15) and use the general solution Eq. (8.7) for [02], where S is the oxygen solubility of the binder and ф^ is the mole fraction of oxygen in air. Thus, at the air-paint
interface (z’ = z/h = 1), we obtain a Voltera-type integral equation for the function gt(t) = dg( t)/dt = df( t)/dt
where Po = [O2 ]0 S ~1фоІ is the initial pressure amplitude. In principle, after Eq.
(8.19) is solved for f(t), the unsteady pressure can be recovered, i. e.,
p( t ) = po f( t ) . However, since the non-dimensional time variable t’ = tDm / h2
in Eq. (8.19) contains the diffusion timescale Tdf = h2 / Dm, recovery of the true
unsteady pressure is affected by the local paint thickness unlike steady-state PSP measurements where the effect of the thickness is, at least theoretically speaking, eliminated by the intensity ratio procedure.
![]()
|
|
|
|


