Delta Wings, Swept Wings, and Car Models
PSP measurements on delta wings, swept wings and car models at low speeds were performed at ONERA in France and DLR in Germany to optimize their paint formulations, hardware and software for low-speed measurements (Engler et al. 2001a). It is realized that PSP measurements at low speeds require the accuracy of 0.1% over a pressure range of 800-1000 mb. This accuracy is difficult to achieve using a typical PSP with a temperature sensitivity of 1%/K because a temperature change of 0.1 K could produce an error as large as a required pressure resolution. Furthermore, the accuracy of PSP is further reduced due to the camera noise and variation of the excitation intensity during a test run. The most common procedure to deal with the temperature effect is application of in-situ calibration to correlate the local luminescent intensity to the corresponding pressure tap data under an assumption that the temperature distribution on a model is uniform. In this case, the temperature-induced error is absorbed into an overall fitting error in in-situ calibration. Even though some systematic errors are removed, it is impossible for this procedure alone to reduce the error to a level equivalent to that caused by a temperature change of 0.1 K on a non-uniform thermal surface in wind tunnel tests. After investigating low – speed PSP measurements in large production wind tunnels at NASA Ames, Bell et al. (1998) pointed out that the most significant errors were due to the temperature effect of PSP and model motion. Therefore, a better solution is the combined use of in-situ calibration with a temperature-insensitive PSP. An illumination field should be measured in order to correct both the spatial and temporal excitation variations on a surface. Furthermore, a large number of images (up to 64) should be averaged to reduce the camera noise.
Engler et al. (2001a) tested three Pyrene-based PSP formulations for low – speed measurements. One was the B1 PSP developed by OPTROD in Russia, in which a pressure-insensitive reference dye was added to correct the excitation variation when performing a ratio between the pressure and reference emissions. The temperature sensitivity of the B1 PSP was 0.5%/K which could not be neglected when a high accuracy for pressure measurements was required. Another was the PyGd PSP developed at ONERA, containing Pyrene as a pressure-sensitive dye and a gadolinium oxysulfide as a reference component. The two components absorbed the ultraviolet excitation light and emitted the luminescence at different wavelengths. Besides its high sensitivity to pressure, the PyGd PSP displayed a very low temperature sensitivity of 0.05%/K because the temperature sensitivity of the reference component was almost the same as Pyrene and thus an intensity ratio between the two components compensated the temperature effect of Pyrene. Therefore, this paint was suitable to low-speed PSP measurements. The PdGd PSP, developed at ONERA mainly for transonic flows, was also tested to evaluate its feasibility and accuracy of measurements at low speeds. This paint was a mixture of PSP and TSP, containing a pressure – sensitive component Palladium octaethylporphine (PdOEP) and a temperature – sensitive component Gadolinium oxysulfide having a temperature sensitivity of 1.5%/K.
Illumination system used was a Mercury light filtered in a UV range (325±15nm or 340±35nm) and a xenon-flash lamp equipped with four optical outputs with 25-Hz repetition rate (308 nm); the lights were connected to liquid light guides to illuminate models. Cooled CCD cameras (512×512, 1024×1024 or 1340×1300 pixels) with back illuminated detectors were used. A filter holder was placed in the front of the lens or the CCD chip. The filters separated the emitted lights from the pressure component (430-510 nm) and from the reference component (615-625 nm). For the PdGd paint, the third filter was required for the temperature-sensitive component at 480-520 nm. The exposure time was typically 1-30 seconds, depending on the illumination source, camera, and size of a test section. Filter-shifting device and two-camera system were developed to acquire the pressure and reference images.
Preliminary measurements at low speeds were made on a delta wing to identify the major error sources and evaluate the performance of different paints (B1, PyGd and PdGd) under the same flow conditions. The delta wing with a 500-mm chord and a swept angle of 75° was successively painted with the three PSPs. The model was mounted in the ONERA low-speed research wind tunnel having a test section of 1-m diameter and the maximum speed of 50 m/s. The model was equipped with 47 pressure taps used to assess the accuracy of PSP. Ten images for each filter setting (blue or red filter) were taken using the CCD cameras (512×512 and 1340×1300 pixels) for frame averaging.
|
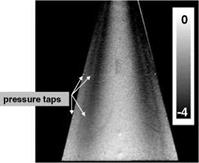
Fig. 9.10. The pressure coefficient C map obtained using the PyGd PSP on a delta wing at 25 m/s. From Engler et al. (2001a) |
Figure 9.10 shows a typical image of the pressure coefficient Cp on the 75°-
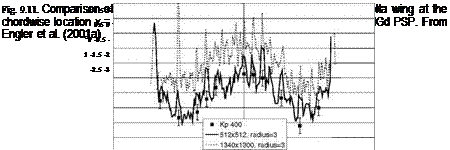
delta-wing obtained using the PyGd PSP at 25 m/s and the angle of attack of 32o. The leading-edge vortex signature was clearly visualized on the model and the secondary vortices were distinguished from the primary vortices. Figure 9.11 shows the distributions of Cp obtained using the B1, PyGd and PdGd PSPs at the
chordwise station equipped with pressure taps, where the error bars of 1 mb (0.0145 psi) indicate the accuracy of PSP measurements. The results obtained
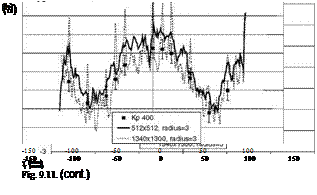 |
using the PyGd PSP are in good agreement with the pressure tap data and less noisy compared to those given by the B1 and PdGd PSPs. This is due to not only much higher luminescent emission from the PyGd PSP, but also very low temperature sensitivity of the PyGd PSP. Spatial averaging was applied to the PSP data over a 3-pixel-radius circle around each pixel. Since a 3-pixel radius in a 512×512-pixel camera corresponded to a larger area on the surface, spatial averaging on the image plane was more effective for the 512×512-pixel camera, which was evidenced by a reduced noise level of the results. Since the PdGd PSP was a mixture of PSP and TSP, the temperature fields were also obtained, indicating a temperature increase of 0.2 K on the wing surface from the left to right. Moreover, by comparing the TSP images taken before and after the test, a temperature increase of 1.6 K was observed in a test run of 30 minutes due to the heat dissipated by the motor of the wind tunnel. Other researchers also measured the pressure distributions on delta wings using PSP at low speeds (Morris 1995; Shimbo et al. 1997; Le Sant et al. 2001a; Verhaagen et al. 1995). The flow over a delta wing is particularly suitable to testing the capability of PSP at low speeds since there is a relatively large pressure change induced by the leading edge vortices on the upper surface.
(c)
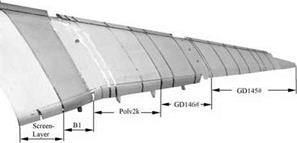
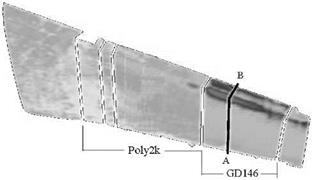
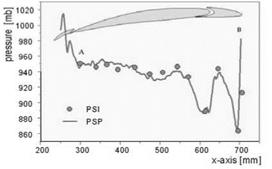
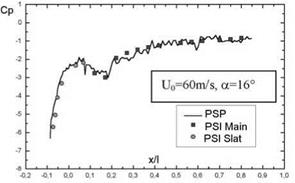
Measurements on swept wings were performed in the Low-Speed-Wind-Tunnel (LSWT) of Daimler-Chrysler Aerospace at Bremen in German. This Eiffel-type wind tunnel with a 2.1×2.1 m test section was operated in a range of velocities from 30 to 75 m/s. Images were acquired at 10 minutes after the tunnel was turned on to stabilize flow temperature and minimize the temperature effect on PSP. During the tests, all ambient light sources were covered and the test section was painted black to minimize reflection of the luminescent light on the walls. After preliminary tests on a swept constant-chord half-wing model to examine the performance of the PSP system, PSP measurements were made on an Airbus A340 half-model. Figure 9.12 shows the wing of the Airbus model coated with different paints including ‘Gottingen Dyes’ (GD) PSPs and B1 PSP of OPTROD. A large number of pressure taps on the wing were available for comparison. Figure 9.13 shows a raw blue image of the wing of the Airbus model illuminated with a 308nm diffuse lamp when the integration time of the CCD cameras was 32 s for 16 images acquired. The GD146 PSP gave the most sensitive signal. Figure 9.14 shows a comparison of PSP measurements with pressure tap data along a chord at the spanwise location AB indicated in Fig. 9.13 on the Airbus model at 60 m/s and the angle of attack of 16o. Figure 9.15 shows a similar comparison between PSP and pressure taps for the wing/slat configuration of a swept constant-chord halfwing model at 60 m/s and the angle-of-attack of 16°. The resolution of ACp = 0.02 was achieved on the swept wings at 60 m/s.
![]()
|
|
|
|
|
|
Fig. 9.15. Comparison of PSP and pressure tap data for the wing/slat configuration of a swept constant-chord half-wing model at 60 m/s and the angle of attack of 16o. From Engler et al. (2001a) |
Engler et al. (2001a) and Aider et al. (2001) measured the pressure distributions on car models at low speeds. The models were a Daimler Benz and a PSA Peugeot Citroen (900 mm long, 400 mm wide and 350 mm high). The tests were conducted in the ENSMA’s T4P low-speed wind tunnel at Poitiers in France and in the Daimler Benz wind tunnel at Sindelfingen in Germany. The maximum velocity of these tunnels was 65 m/s and the free-stream turbulence intensity was less than 1%. Figure 9.16 shows typical PSP data mapped onto a CFD grid of the Daimler Benz model, where 64 raw images were averaged to reduce the camera noise. The total time to acquire all the wind-on and wind-off images was longer than one hour since the powerful 308-nm light sources were not available for these tests and a long integration time for the camera was required. Fortunately, the static temperature of flows in the wind tunnels was stable enough such that an error produced by a long-time temperature shift in the tunnels was small. Figure
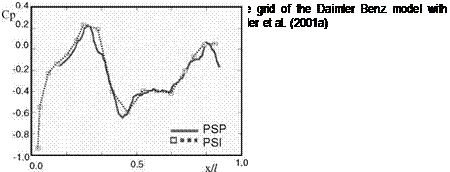
9.17 shows a comparison between PSP and pressure tap data along the centerline of the Daimler Benz model. The absolute pressure accuracy of about 1 mb (0.0145 psi) was achieved after a large number of images were averaged. Figure
9.18 presents a comparison between PSP and pressure taps on the rear window of the PSA Peugeot Citroen model at 40 m/s along the left-hand sideline A and the centerline C equipped with pressure taps. In this case, the absolute pressure accuracy was better than 1 mb. There was an interesting difference between the pressure distributions along the sideline A and centerline C. There was only one pressure minimum point along the centerline C through the roof/window junction. In contrast, two pressure minimum points existed along the sideline A, which corresponded to the roof/window junction and a vortex system around the car, respectively. PSP was able to visualize the pressure signatures associated with complex flow patterns that were completely missed in pressure tap data such as a pressure peak between the two pressure minimum points along the sideline A.
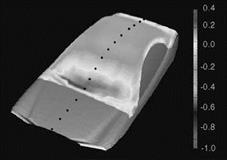 Fig. 9.17. The pressure coefficient distribution obtained from PSP compared with pressure tap data at the centerline on the Daimler Benz model at 60 m/s. From Engler et al. (2001a)
1.006
1.004
![]()
![]()
![]()

![]()
![]() 1.002
1.002
1.000
0.998
![]()
 |
0.996
0.994
0.992
0.990
0.988
0.986 200
Fig. 9.18. Comparison of PSP with pressure tap data along the sideline A and centerline C on the rear window of the PSA Peugeot Citroen model at 40 m/s. From Engler et al. (2001a)


