Simulation Setup
To investigate the influence of different numerical parameters, steady and unsteady RANS simulations are performed. The TAU code developed by the DLR is used for all simulations. Test object is the RAE 2822 airfoil. The inflow conditions are chosen according to the known Case 9 [1].
Maoo = 0.73, T = 288.15K, Re = 6.5e+6, a = 2.80°
The following section gives a summary of the performed investigations and their results. As mentioned above the Taguchi method allows to evaluate also the influence of the interactions between the parameters. Therefore, the different parameters are partitioned into several groups. Each group contained physically or numerically related parameters.
For the steady simulations (Run 1 till 5) the influences of each particular parameter on the results for the lift coefficient Q, total drag coefficient Cd, pressure drag coefficient Cdp and viscous drag coefficient Cdv are investigated.
In case of the unsteady simulation the influence on the averaged lift and drag coefficients Cimean and Cdmean, their amplitudes ClA and CdA as well as their RMS values Clrms and Clrms is shown. Additionally, the influence on the buffet frequency is described.
All simulations are performed with the TAU-version 2008.1.1 and the meshes are all generated with GridGEN 15.11. The mesh generation is script based and all meshes are structured (C-mesh). For the mesh variation (Run 1 and 3) several different meshes are generated, each with another resolution, y+ value and grid resolution at leading and trailing edge. The mesh resolution is based on the number of points along the airfoil surface (upper and lower side).
No. of grid points:
19580 with 128 grid points on the airfoil surface,
79476 with 256 grid points on the airfoil surface,
320228 with 512 grid points on the airfoil surface,
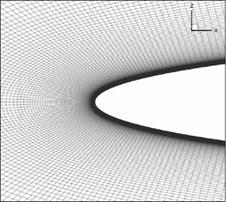
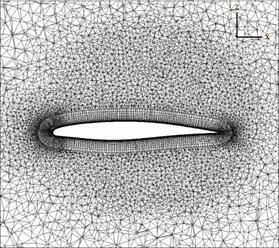
Figure 4 shows the leading edge region of the finest mesh with 512 points along the
airfoil surface. The TAU settings are chosen as follows:
k2-dissipation factor: 0.5
k4-dissipation factor: 64
CFL number: 1.5
Turbulence Model: Menter-SST
|
Fig. 4 Leading edge region of the finest mesh |
4 Results
Run 1: Mesh resolution, Boundary layer resolution
Taguchi Matrix: L27
No. of levels: 3 for each parameter
Parameters: y+, Number of grid points on the airfoil surface,
mesh resolution leading edge, mesh resolution trailing edge
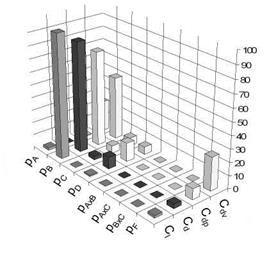
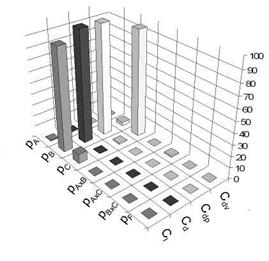
In the first case the influences of different grid parameters, including the y+ value, number of grid points on the airfoil surface, which determines the overall mesh resolution, as well as the local grid resolution at leading (LE) and trailing edge (TE) are evaluated. The last two mentioned properties are defined by the distance of the points on the airfoil surface. The mesh resolution at leading and trailing edge is set to coarse, medium and fine. The total value for each level depends on the total number of grid points on the surface. Defining the resolution at leading and trailing edge this way, guarantees meshes which are similar to each other. Table 1 gives an overview of the resulting total values, given in per mille of the chord length. The y+ value determines the height of the first cell row at the airfoil surface. The values for the three levels are 0.5, 1 and 2. Figure 5 shows the influences of the varied parameters on the coefficients for drag and lift given in percent. The influences of the interactions are shown as well. pAxC for examples denotes the influence of the interaction between parameters A and C. The error occurred during the ANOVA – analysis is given by pF. This value does not represent the influence of the error on the CFD result. It is just an indication for the certainty of the evaluated parameter influences. In this study only interactions with the y+ parameter are investigated. The reason is that four parameters are examined at once, and that there is no suitable Taguchi Matrix which includes four parameters and all their interactions. In Figure 5 it is shown that the influence of the number of grid points on the airfoils surface prevails in comparison to the other parameters. Especially for the results of lift, total drag and pressure drag. In case of the viscous drag also the y+ value shows some significant impact. This is due to the fact that this parameter effects the resolution of the boundary layer. The mesh resolution at trailing and leading edge shows only a small contribution. No interaction between the y+ value and the other parameters is detected.
Table 1 Total value of the grid point distance at leading and trailing edge for different mesh resolutions, given in per mille
|
Level |
512 |
256 |
128 |
|
1-rough |
1 |
2 |
4 |
|
2-middle |
0.5 |
1 |
2 |
|
3-fine |
0.25 |
0.5 |
1 |
|
Fig. 5 Results of run 1. A = y+, B = number of grid points on airfoil’s surface, C = mesh resolution TE, D = mesh resolution LE |
Run 2: Inflow conditions
Taguchi Matrix: L27
No. of levels: 3 for each parameter
Parameters: Reynolds number, Mach number, angle of attack
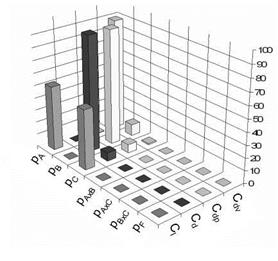
For the investigation on the inflow conditions the Reynolds number is varied by +/- 3 • 105, the Mach number by +/- 0.001 and the angle of attack by +/-0.01°. In this study the fine mesh with 512 grid points on the surface of the airfoil is chosen. The ANOVA analysis yields a large impact of the Reynolds number and the angle of attack on the lift coefficient Cl as it can be seen in Figure 6. This result is comprehensible especially for the angle of attack. But it is also known that the lift increases with a rising Reynolds number. In transonic region the Mach number has a large influence on the total drag values because the pressure drag which is also mainly influenced by the Mach number has a large share in the total drag. The viscous drag, however, is only influenced by the Reynolds number. But it has only a low impact on the total drag.
|
Fig. 6 Results of run 2. A = Reynolds number, B = Mach number, C = angle of attack |
Run 3: Turbulence modeling (a)
Taguchi Matrix: L27
No. of levels: 3 for each parameter
Parameters: Mesh resolution, CFL-number, numerical diffusion
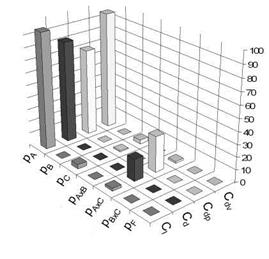
In this case the mesh resolution at leading and trailing edge is set to the medium value. The levels of the CFL number are set to 1.5, 3.25 and 5. The numerical diffusion terms are changed simultaneously. Their levels are (1/32; 1.00), (1/64; 0.50) and (1/128; 0.25) for k2 and k4 respectively. This study is done for several turbulence models like Menter-SST, Spalart Allmaras with Edwards correction (SAE), Linear Algebraic Stress Model (LEA) and for the Reynolds Stress Model (RSM). The results are very similar for all turbulence models. Therefore, only the result for the SAE model is exemplified in Figure 7. The analysis shows that the mesh resolution has a main impact on all results again. The CFL number has no influence. This behaviour agrees well with the theory as long as all simulations are converged like in the present case. The influence of the numerical diffusion is also very small, but the interaction between the mesh resolution and the numerical diffusion shows a larger influence on the results. This is reasonable as the mesh has also a damping effect on the solution if it is too coarse. Since in this study only three parameters are investigated, the evaluation of all interaction effects is possible by using a L27 Matrix.
|
Fig. 7 Results of run 3. A = number of points on airfoil’s surface, B = CFL-number, C = Diffusion terms |
Run 4: Turbulence modeling (b)
Taguchi Matrix: L27
No. of levels: 3 for each parameter
Parameters: Turbulence model, CFL-number, numerical diffusion
This is based on the results of run 3, which was performed for several turbulence models (Menter-SST, SAE, LEA). By rearranging the performed simulations, it is possible to replace the mesh resolution parameter by the turbulence model. A new ANOVA analysis shows that in this case the influence of the turbulence model outbalances all other parameters. This is not surprising because it is known that the turbulence model has a large impact on the CFD result, and the other parameters are not varied to such an extent to compete with the turbulence model.
Run 5: Geometry
Taguchi Matrix: L27
No. of levels: 3 for each parameter
Parameters: Trailing edge thickness, number of geometry-defining points,
bump height
The three levels of the trailing edge thickness are 0%, 0.5% and 1% of the chord length. The number of points defining the contour of the airfoil are set to 100, 200 and 400. Finally a sinus function is superposed with the leading edge contour to
|
Fig. 8 Results of run 5. A = number of geometry-defining points, B = Trailing edge thickness, C = Bump height. |
simulate bump-shaped disturbances in the leading edge region. These bumps represent the uncertainty in fabrication process. The amplitude levels of these bumps are set to 1 • 10~4, 2 • 10~4 and 3 • 10~4 times the chord length. For the simulation the mesh with 256 points on the airfoil’s surface is chosen. The trailing edge is discretized with 56 cells and 110 cells for a trailing edge height of 0.5% and 1 % chord. The results show that the number of points has no influence. This is due to the fact that even 100 points are still sufficient to describe the airfoil’s contour nicely. The coefficients for lift, total drag and pressure drag are mainly affected by the trailing edge thickness while the viscous drag is influenced by the bump height. The bump height has an impact on the pressure distribution along the airfoil’s surface. The acceleration and deceleration along the wavy surface changes the load on the boundary layer which affects the viscous drag.
Run 6: Unsteady simulation
Taguchi Matrix: L27
No. of levels: 3 for each parameter
Parameters: CFL-number, Number of inner iterations, At
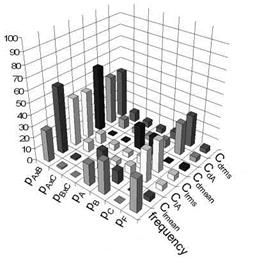
To get unsteady flow characteristics, the angle of attack is increased to 5°. For this angle of incidence buffet effects occur, i. e. that the shock on the upper surface starts to move with a distinct frequency. Therefore also the force coefficients fluctuate. In case of an unsteady simulation not only the mean force coefficients but also their
|
Fig. 9 Results of run 6. A = unsteady physical time step size; B = Number of inner iteration; C = CFL-number. |
amplitudes, rms-values and frequencies can be analyzed. The CFL number is set to 3.4, 1.7 and 0.8 for the coarse multigrid and to 10, 5 and 2.5 for the fine multigrid. The ratio tchar to At is defined to 20, 40 and 80. Where tchar = UJc is the time the air needs to flow over the airfoil. The levels for the number of inner iterations are 50, 100 and 200. Looking at the results plotted in Figure 9 it must be said first that the CFL number has a larger impact on several results. As mentioned before this should not be the case if all simulations are converged. But in this study the inner iterations of some unsteady simulations are not converged. This explains the recognized influence of the CFL number. Furthermore, the unsteady physical time step size At/tchar has an influence on the mean values of the force coefficients and the frequency but not on the unsteady parts of the force coefficients, the rms-value and the amplitude. The unsteady physical time step size has also an indirect effect on all parameters through the interaction with the number of iterations. This interaction often has the strongest influence of all parameters. All other interaction effects can be neglected. The number of inner iterations has a direct influence on the frequency and the mean values.
Run 7: Robustness test
Taguchi Matrix: L27
No. of levels: 3 for each parameter
Parameters: Reynolds number, Mach number, angle of attack
The study for the inflow conditions is repeated, but the variation of the parameters is increased to three times the value as in run 2. The Mach number is now varied by +/-0.003, the angle of attack by +/-0.03° and the Reynolds number is varied by +/- 9 • 105. This study provides almost exactly the same results as run 2. This confirms the robustness of the Taguchi Method that shows that the obtained results are also valid for larger (or smaller) parameter variations.
Run 8: 3D Simulation
Taguchi Matrix: L27
No. of levels: 3 for each parameter
Parameters: Reynolds number, Mach number, angle of attack
Finally the Taguchi Method is used for the analysis of 3D simulations of the generic SFB-401 wing. Geometry and mesh are provided by the DLR. The mesh has 9.5 million points. The boundary layer is resolved with 80 layers in wall normal direction. The boundary conditions are chosen to Ma = 0.8, Re = 23.5 • 106 and angle of attack of 1°. For the 3D simulation a Taguchi analysis of these boundary conditions is performed as it is already done for the RAE 2822 2D-airfoil shown before (Run 2). The variation of the Mach number is 0.001 and the angle of attack is varied by 0.01°. These variations are the same like in the investigation of the 2D-airfoil since the total values of these parameters are similar for the 3D and the 2D case. The Reynolds number is varied stronger than before as the Reynolds number of the 3D SFB-401 case is much higher than for the 2D test case. Therefore, it is varied by +/- 1 • 106 instead of +/-3 • 105. For the simulations the SAO turbulence model is used. The dissipation factors are set to 0.5 and 64 for k2 and k4 respectively. Figure 10 shows a cut through the mesh at n=0.77.
The cp distribution is shown in Figure 11. Inboard a shock appears due to supersonic flow at x/c=0.6 for n=0.23. Further outboard at n=0.77 no shock is observed. These results are extracted from the simulation with Ma=0.799, Re=22.5 • 106 and angle of attack a=1.01°. The ANOVA analysis yielded results comparable to the 2D case but shows up also some differences (see Figure 12). The viscous drag is again mainly affected by the Reynolds number. Mach number and angle of attack have no influence. Looking on the pressure drag it can be recognized that the Mach number has the largest influence followed by the angle of attack which has some small contribution. The influence of the angle of attack is increased compared to the 2D airfoil as it has some impact on the induced drag which is a pressure drag as well and occurs only for lift producing 3D geometries. The results for the total drag show some differences to the 2D case. The impact of the Reynolds number is much higher for the 3D case. This can be explained by the larger contribution of the viscous drag to the total drag compared to the 2D case. For the 3D case the viscous drag is of the same size as the pressure drag while for the 2D case the pressure drag was twice the viscous drag. Therefore, the Reynolds number has a larger impact on the total drag for the 3D case. However, the influence of the Reynolds number on the
|
Fig. 10 Mesh of the SFB-401 wing. Cut at n=0.77 |
lift coefficient is smaller than in case of the 2D airfoil. This can be explained by the larger Reynolds number which is four times higher than for the 2D case. Therefore, the influence of the viscous forces on the lift will be smaller than for the 2D case. The higher contribution of the viscous drag to the total drag, mentioned before, is rather explained by a different geometry than by a different Reynolds number.


