Numerical Methods
There are two classes of axisymmetric flow problems that are treated numerically: (1) the direct problem of finding the flow about a body of given shape, which may be solved by using a distributed singularity along the body axis or a panel method; and (2) determining a body shape that results in low or minimum drag. This can be accomplished by using two different approaches. The first is to consider an inverse problem: Find the body shape that gives a desired pressure distribution on the body. The pressure distribution, in turn, is chosen so as to reduce or minimize the friction and pressure drag due to the boundary layer growing on the body surface. The second approach uses optimization algorithms and seeks to optimize the body shape for minimum drag subject to certain constraints. A brief discussion of each method follows.
1. The direct problem: What is the surface-pressure distribution for a body of specified shape?
|
(*-*p) >/(*-*0)2 + r2 |
(a) Distributed singularities along the body axis. We first derive an expression for the stream function in axisymmetric uniform flow due to a distributed source along the x-axis. We begin by generalizing Eq. (7.35) to represent the superposition of uniform flow and a point source located at x = x0. Thus,
where Л is the strength of the source. Next, we consider a source distributed along the x-axis between x = 0 and x = L. We rewrite Eq. 7.38 to describe a differential contribution to the stream function at a field point (x, r) due to a differential length, d£ , of that distributed source located at E = x:
where p(E) is the local strength of the distributed source per unit length.
|
_! J b(£)(*~ £)<*£ + r2 4E)+r2 2 ‘ |
Now, we sum the contributions to the stream function at (x, r) due to all of the differential lengths of distributed source between x = 0 and x = L. We let the distributed source represent a closed body of revolution, where L is the length of the body. Summing by integration:
The first term in the square brackets in Eq. 7.39 vanishes on integration because if the body is closed, the net source-sink strength over the length of the body must be zero. Thus, L
J b(E)d£ = 0.
Recall that by definition, Eq. 7.30, the expressions for the velocity components ux and ur follow from the expression for the stream function by differentiation namely:
In Eq. 7.40, the integration is relative to the variable E so that the integrand may be differentiated directly. If p(x) is represented as a polynomial, then the integral expressions for у, Eq. 7.40, and for ux and ur, Eq. 7.41, may be evaluated in closed form.
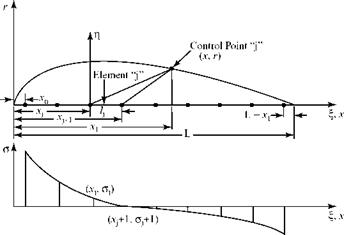
Following Zedan and Dalton (1978), the source-strength distribution along the x-axis is split into N segments, each of length ALj, and Eq. 7.40 is expressed as a summation. Zedan and Dalton, 1978 considers a linear-source distribution over each segment; this is generalized to a polynomial distribution in Zedan and Dalton, 1980. Figure 7.13 illustrates an assumed linear variation over each segment.
Notice that the source-strength variation is assumed and known but the magnitude of the strength is to be found. Referring to Fig. 7.13, let there be N source segments used to represent the body of revolution and let the strength distribution in each segment be of the following form:
PE = (a + bE),
where a, b are constants to be determined. The parameter E is the local axial coordinate over each segment ALj.
 |
 |
With two constants a, b to be found for each of N segments, there are 2N unknowns. We next require that the source distributions are continuous at the junctions of the segments (i. e., there cannot be any step in source strength from one segment to the next). If there are N segments, then there are (N-1) junctions. Thus, the demand that the strength distribution be continuous at each juncture results in (N-1) equations involving the 2N unknowns, leaving (N+1) equations to be generated if the a, b unknowns are to be found and the source-strength distribution along the axis determined.
where Aij is a matrix that is a function only of the known body geometry (see Zedan and Dalton, 1978), p, is the source intensity at the jth juncture, and r = R on the surface. The closure condition, which states that the net efflux of all of the source-sink elements must be zero, supplies the final equation required; namely:
N N A Lj
|
1 N = — У i(*T) 4n f-1 |
|
X"1 л Т/ *i У Aj V~— j = 1 2 _ |
![]()
 |
(7.43)
where Qj is the mass efflux over the jth source-sink segment.
As noted in previous discussions, the body surface must be a streamline, meaning that on the body surface ¥ = constant and, for convenience, ¥ = 0. Setting ¥i = 0 in Eq. 7.42 at N control points on the body surface results in a system of N linear-algebraic equations in (N+1) unknowns pj. The addition of the closure equation, Eq. 7.43, provides the needed additional equation. Solving this set of equations provides the values of the source strength, pj, at the juncture points of the source distribution.
Now, using Eq. 7.41, the expression for the axial-velocity component at the ith control point follows from Eq. 7.42 as:
where Bjj is a matrix that is a function only of the known body geometry (Zedan and Dalton, 1978). Because the source strength pj was found in the previous step, the axial-velocity component ux is determined at each control point on the body surface.
Tangency requires that ux/ ur = dR / dx at the body surface, where R(x) is known. Hence, the radial-velocity component, ur, is determined at each control point. Lastly, Vt2 = ul + иГ and the tangential velocity, Vt at each control point is found. The surface pressure on the prescribed body follows directly from the Bernoulli Equation and the direct problem is solved.
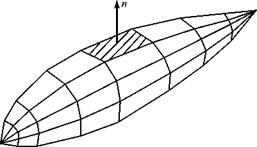
(b) The panel method. The direct problem also may be analyzed numerically by distributing singularities over the surface of a given body. This is simply the panel method discussed in Chapter 6; again the surface singularities may be sources, doublets, or vortices. We restrict the discussion here to surface sources because we are considering bodies of revolution at zero angle of attack. As before, flat quadrilateral surface panels approximate the given body, as shown in Fig. 7.14. Notice in what follows that the panel method is a three-dimensional problem even for a body of revolution at zero angle of attack because each source panel affects the flow at all other panels present in three-dimensional space.
Figure 7.14. Representation of a body of revolution with flat panels.

![]() In contrast, solution methods using source distributions along the body axis are formulated in cylindrical coordinates and use axisymmetric-flow equations. Thus, the panel method has an advantage over the distributed-source method in that the former can be extended to fuselage shapes that are not bodies of revolution.
In contrast, solution methods using source distributions along the body axis are formulated in cylindrical coordinates and use axisymmetric-flow equations. Thus, the panel method has an advantage over the distributed-source method in that the former can be extended to fuselage shapes that are not bodies of revolution.
The velocity-potential expression valid for a three-dimensional source may be derived analogously in Cartesian coordinates to the way in which the stream function was derived previously in this chapter. The velocity potential at Point P (x, y,z) due to a point source of strength L located at Point Q(£,n, Z) is given by:
where PQ is the distance between Points P and Q. This solution of the potential equation may be superposed with another solution representing a uniform flow from infinity, ф( x, y, z) = x.
Now, we assume that instead of being a point source, the source has a strength p per unit area, which is distributed over a differential panel area dA. The source distribution may be assumed to be constant over the surface, Aj, of a quadrilateral panel, or a higher-order distribution over the panel surface may be used. Then, the velocity potential at Point P due to the superposition of a uniform flow and a distributed source on Panel Q is given by:
Jf^ A
A 1
ФА y, z) = Vjc – j——- =. (7.46a)
4n PQ
Assuming that the source distribution per unit area is constant over any quadrilateral panel, AJ, Eq. 7.46a simplifies to:
Ц і A.
ф( x, y, z) = yMx – 1-=L. (7.46b)
Next, we assign each panel a control point located at the middle of the panel and let the body of revolution be represented by N panels. Then, the velocity potential at the control point on the ith panel, p (x, y, z), due to the influence of the constant – strength sources on all of the N panels plus the influence of the freestream, is:
Notice that the term j = i is excluded from the summation. When j = i, the behavior of that term in the series is singular because the source panel Q is the same panel as that where Point P is located, and PQ = 0 Thus, this term must be treated in a special way, as indicated by the separate term ф|j=1 in Eq. 7.47. Notice that all of the source panels contribute to the potential at a given control point, even the panels on the opposite side of the body from the control point. This is the same behavior that we observed in the case of vortex rings representing a finite wing. Also, we note that the effect of a source at a control point does not depend on the distance between the source panel and the control point as measured along the body surface; rather, the effect is dependent on the straight-line distance between the two, PQ.
Taking (Эф / dn) in Eq. 7.47, where n is the unit outward normal at each control point, yields the velocity component normal to the panel at each control point. According to the surface-tangency-boundary condition, each normal component of velocity must be zero. Applying this boundary condition at each control point, in turn, yields a system of N linear-algebraic equations for the N unknowns, ^j. When the source strengths are determined, the magnitude of the tangential velocity at each control point may be found and, hence, the surface pressure, after an appeal to the Bernoulli Equation. Thus, the pressure distribution over a body of revolution is determined. This pressure distribution may be integrated to obtain forces, if desired.
A comparison of results using axial and surface singularity (i. e., panel) methods for inviscid flow can be found in D’Sa and Dalton, 1986. Here, we conclude that the accuracy of the method using singularities distributed along the axis of symmetry and the accuracy of the panel method using singularities distributed over the body surface are comparable for problems involving smooth bodies. For bodies with sudden changes in curvature, the panel method is more accurate. A boundary-layer code must be appended to both of the solution methods for the direct problem to obtain the drag of the body of revolution.
2. The optimum body-shape problem: Find the body shape that has low or minimum drag in a given application.
(a) The inverse method. This method seeks to answer the “optimum” body-shape question by focusing on the behavior of the boundary layer because it causes the drag. Thus, if a pressure distribution is specified along a body surface with the aim of generating low drag due to viscous effects, what body shape is needed to obtain this pressure distribution? Tailoring the shape of a body of revolution to achieve a low-drag boundary layer is attractive because, as noted previously, the fuselage drag comprises a ma. or fraction of the total drag of a flight vehicle. The viscous boundary layer is discussed in detail in Chapter 8; suffice it to say here that a laminar boundary layer is preferred to a turbulent layer because the former exhibits a much smaller skin-friction drag. The boundary-layer solution code used in conjunction with body-shape tailoring is, of necessity, complex. It must be
able to provide results for both laminar and turbulent boundary layers and it should be able to predict transition (i. e., the laminar boundary layer becomes turbulent) and separation (i. e., the boundary layer leaves the body surface). Either surface-panel or axial-singularity methods may be used in the inverse problem; both are iterative in nature. The axial-singularity method, discussed herein, often is used in practice because it is computationally more efficient than panel methods in this application. In any case, the goals are to (1) achieve a strong favorable pressure gradient (dp / dx < 0) over the front portion of the body of revolution to delay transition, thus reducing frictional drag; and (2) to minimize the adverse pressure gradient (dp / dx > 0) over the afterbody so as to delay boundary-layer separation and thereby reduce pressure drag.
Zedan and Dalton, 1978 and Zedan and Dalton, 1980 discuss an iterative inverse method for finding an axisymmetric body shape with low drag. Again, the basis of the method is a source singularity distributed in N segments along the body axis, (see Fig. 7.13). In Zedan, 1978, the distribution over each segment is linear, whereas in Zedan and Dalton, 1980, the distribution over each segment is represented by a polynomial. Zedan et al., 1994, treat the problem by using a doublet singularity distributed linearly over several segments along the body axis.
The solution method begins similar to the solution of the direct problem. Following (Zedan and Dalton, 1978) the linear-source-strength distribution over each segment shown in Fig. 7.13 is represented by = (a + b£).
With N segments of sources and two unknown constants describing the linear distribution of source strength over each segment, again there are 2N unknowns. By appealing to the continuity of source-strength distribution at each of (N-1) junctures between segments, the number of unknowns is reduced to (N+1). The (N+1) source strengths are found by writing a set of N linear-algebraic equations at N control points, Eq. 7.42, plus one closure condition, Eq. 7.43. This is the same methodology used previously in the axial-source-distribution method for the solution of the direct problem. Thus, rewriting Eq. 7.42 for the stream function at each control point i:
and rewriting the closure equation, Eq. (7.43):
N ALj
Xjp£ (№ = 0. (7.49)
J = 1 о s
Again, the axial-velocity component at the ith control point is found by differentiation of Eq. 7.48; namely:
where A1j and B1j are matrices that are a function only of body geometry (Zedan and Dalton, 1978).
The iterative solution to find the body shape corresponding to a prescribed pressure (i. e., velocity) distribution proceeds as follows:
![]()
![]() Make an initial guess at the body shape, R°(x). This may be a body shape known to have a low drag for which improvement is sought or it may be a baseline ellipsoid shape.
Make an initial guess at the body shape, R°(x). This may be a body shape known to have a low drag for which improvement is sought or it may be a baseline ellipsoid shape.
Calculate matrices Ay and By for this geometry.
Select i = N control points on R°(x). Then, at each control point, calculate dR/dx.
Impose a pressure distribution on the assumed initial body shape. For example, to delay boundary-layer transition, this might be a pressure distribution that has a stronger favorable pressure gradient over the forebody than that exhibited by the low-drag body shape that was used as a first guess. The imposed pressure distribution is changed easily to an imposed velocity distribution through use of the Bernoulli Equation. The velocity calculated in this way is an imposed tangential velocity at each control point.
Require flow tangency at each control point on the body surface. Thus,
UL = dR
ux dx
|
|
|
|
|
|
|
|
the tangency condition at each point i on the body surface may be written as:
|
|
![]()
![]() With ux corresponding to the imposed pressure distribution now known from Step 5 at each control point, write Eq. 7.50 as a set of (N) linear-algebraic equations in terms of (N+1) unknown source strengths, Pj. The remaining equation for comes from closure, Eq. 7.49. Solving this system yields the source-strength distribution Pj at the juncture points corresponding to the R° body shape but with the imposed velocity distribution.
With ux corresponding to the imposed pressure distribution now known from Step 5 at each control point, write Eq. 7.50 as a set of (N) linear-algebraic equations in terms of (N+1) unknown source strengths, Pj. The remaining equation for comes from closure, Eq. 7.49. Solving this system yields the source-strength distribution Pj at the juncture points corresponding to the R° body shape but with the imposed velocity distribution.
Write Eq. 7.48 on the body surface by setting ^ = constant = 0 at each control point. With pj and Ay known, a new body shape is found by solving the resulting equation for R;; namely:
![]() -1 Vі л
-1 Vі л
2п V J AjUj.
Notice how the two different descriptions of the body surface—flow tangency and у = constant—are used to set up the iteration.
The body radius from Step 7 represents an improved body shape, R1. Use this in Step 1 and calculate the new matrices in Step 2. Then, repeat the iteration until satisfactory convergence is achieved. The final result is a body shape corresponding to the imposed pressure gradient.
|
|
|

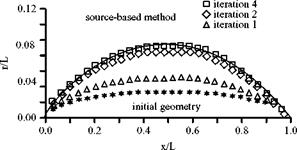
Figure 7.15 shows a body generated by the source-based inverse method discussed previously for the case of a shape with a known solution. The converged shape closely matches the reference profile after only a few iterations. Zedan, 1978, point out that this method fails for a body geometry that has an inflection point. An alternative plan is presented for this special case.
The drag of the body shape given by the iterative solution is found by performing a viscous-flow solution for a boundary layer growing on a surface in the presence of the prescribed pressure gradient. Running a few solutions provides a good physical idea of what is happening and a physical basis for a drag-reduction strategy.
(b) Mathematical optimization techniques. These techniques require a large number of numerical calculations. Parsons et al., 1974 present a computer – based optimization procedure for generating low-drag hull shapes useful for hydrodynamic applications. The method incorporates a parametric body description, a drag computation, hydrodynamic constraints, and an optimization scheme in the form of a computer program. Lutz and Wagner, 1998, describe an optimization scheme that uses a segmented linear distribution of sources along the body axis, much like the inverse method discussed herein. However, the source strength is used as a variable for the optimization process. This indirect method is combined with an integral boundary – layer method and an optimization algorithm. The focus of their work is on airship applications. The objective is to minimize the drag of the hull for maximum hull volume (i. e., lifting capacity) at different speeds (i. e., different Re number values). The student is referred to the literature for details of these and other optimization methods.
7.3 Numerical Methods for the Complete Airplane
Panel methods also are used to solve for the flow around a complete airplane. Such a solution furnishes the inviscid-flow pressure distributions on the various airplane components and predicts the forces and moments on the vehicle in an inviscid flow. Thus, the results are most useful for flight vehicles in cruise or without large separated-flow regions. The interference effect between a wing and a fuselage and in a wing/fuselage juncture also may be studied by using these numerical solutions. That is, the flow around a vehicle component in isolation is
|
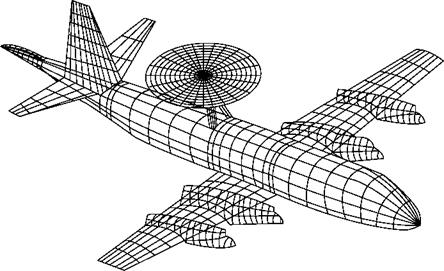
Figure. 7.16. Surface-panel configuration for a complete airplane (Tinoco, 1990). |
not identical to the flow around that same component when the component is in proximity to another body in the flow. The aerodynamic characteristics of an airplane, then, are not simply the sum of the aerodynamic characteristics of all of its parts. In numerical solutions for a complete airplane, source or doublet panels usually are used to represent the fuselage, and the lifting surfaces are analyzed by the VPM or the VLM.
A panel representation of a complete airplane is shown in Fig. 7.16. The objective of this computer simulation was to guide the positioning of the large radome so that the aerodynamic center of the aircraft was unchanged.
Singh et al., 1989 describe a calculation method for finding the potential flow around a complete aircraft configuration. The fuselage is represented by sources distributed along the wetted surface, whereas the wing and wing-like components are modeled by using source and vorticity distributions on their respective mean – camber surfaces. Boundary-layer effects are not included.
The aerodynamic behavior of a complete subsonic transport and partial-model results for the same transport (i. e., results for wing alone, tail on/off) are found by using a panel method and discussed by Troeger and Selby, 1998. Code VSAERO, which uses piecewise constant source and doublet singularities distributed on flat, quadrilateral panels, is used for the computations. The results are compared with experimental data, and it is found that discrepancies between analysis and experiment are caused primarily by viscous effects, which are ignored in the panel method. The model of the complete transport uses 3,655 surface panels for the vehicle and 2,133 wake panels.
As mentioned previously, CFD is being used more frequently in the field of aerodynamics and is of great value as a wind-tunnel partner in the solution of many complex flow problems. Recently, CFD has made increasingly larger contributions to the aircraft-design process; this evolving role of CFD is discussed by Tinoco, 1998 and Dodbele et al., 1987. The student is encouraged to read the literature on this fascinating application of numerical methods.


