STEPS TOWARD CONSTRUCTING A NUMERICAL SOLUTION
When establishing a potential-flow numerical solution a sequence similar to the following is recommended.
Selection of singularity element. The first and one of the most important decisions is the type of singularity element or elements that will be used. This includes the selection of source, doublet, or vortex representation and the method of discretizing these distributions (zero-, first-, second-order, etc.). Also, all of the questions raised in the previous section need to be answered before the actual formulation of the solution can be constructed. Once these decisions have been made an influence routine needs to be established, similar to the model of Eq. (9.22). This influence computation is a direct function of the element geometry and the resulting output of such a routine is the velocity components and the potential (Am, Ді/, Aw, ДФ) induced by the element. In general, the implementation of Eq. (9.22) represents the core of most numerical solutions. Therefore, in the next chapter some of the more frequently used singularity elements will be formulated.
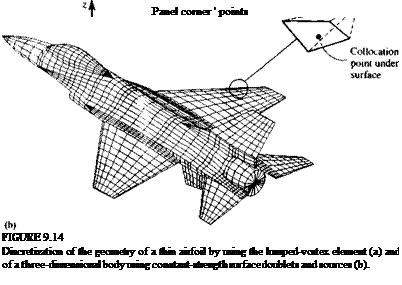
Discretization of geometry (and grid generation). Once the basic solution element is selected, the geometry of the problem has to be subdivided (or discretized), such that it will consist of those basic solution elements. In this grid-generating process, the elements’ corner points and collocation points are defined. The collocation points are points where the boundary conditions, such as the zero normal flow to a solid surface, will be enforced. Figure 9.14m shows how the cambered thin airfoil at an angle of attack can be discretized by using the lumped-vortex element. In this case the camberline is divided into five panels and the location of the collocation points and of the vortex points are shown in the figure. Similarly, the subdivision of a three-dimensional body into planar surface elements (the collocation points are not shown but they are at the center of the panel and may be slightly under the surface) is shown in Fig. 9.14 b.
It is very important to realize that the grid does have an effect on the solution. Typically, a good grid selection will converge to a certain solution when the density is increased (within reason). Also a good grid selection usually will require some preliminary understanding of the problem’s fluid dynamics, as will be shown in some of the forthcoming examples.

Influence coefficients. In this phase, for each of the elements, an algebraic equation (based on the boundary condition) is derived at the collocation point. To generate the coefficients in an automatic manner, a unit singularity strength is assumed and the element influence routine is called at each of the collocation points (by a DO loop).
Establish RHS. The right-hand side of the matrix equation is the known portion of the free-stream velocity or the potential and requires mainly the computation of geometric quantities (e. g., —Q„a).
Solve linear set of equations. The coefficients and the RHS of the algebraic equations were obtained in the previous steps and now the equations are solved by standard matrix techniques. Here it is assumed that the reader is familiar with such numerical solvers, which can be found in text books (e. g.,

 |
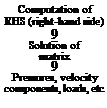
FIGURE 9.15
Typical flow chart for the numerical solution of the surface singularity distribution problem.
Ref. 9.4 or as the solvers appearing in the student computer programs of Appendix D).
Secondary computations: pressures, loads, velocity, etc. The solution of the matrix equation results in the singularity strengths and the velocity field and any secondary information can be computed now. The pressures will be computed by the Bernoulli equation, and the loads and aerodynamic coefficients by adding up the contributions of the elements. A typical flow chart for such a computer program is shown in Fig. 9.15 where the sequence of computations is close to the above-described methodology.
In the following example, the essence of the above steps will be clarified.


