General properties of wings at low speeds
6.5 We consider first in more detail some of the important effects of viscosity. Experimental evidence has been provided among others by P В Earnshaw & J A Lawford (1961), J A Lawford (1964), and D A Lemaire (1965), and we refer especially to the extensive
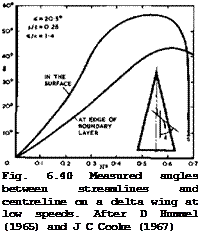
measurements, by D Hummel (1965) and by L F East (1974), of the peculiarities of the boundary layers which develop in the flow induced by the vortex sheets. We have already noted that the boundary layer is essentially threedimensional, even when the outer inviscid stream may be regarded as conical, and we are therefore interested in theories which can deal with general threedimensional flows, laminar as well as turbulent. These are necessarily quite complex (see e. g. J C Cooke & M G Hall (1962)), and there is thus every incentive to try out assumptions which might simplify matters. One which would really help in this respect is the assumption that the crossflow velocity components are small as compared with the mainstream velocity. This may be justified for thin wings with attached flow, but not in the highly-curved flow typical of lifting wings with fully-developed vortex sheets. An example in Fig. 6.40 (for a rather extreme case of а/к « 1.4 , where the upper-surface attachment
 LIVE GRAPH
Click here to view line has reached the centre line), from Hummel’s tests, shows that the streamlines at the edge of the boundary layer and, more particularly, the limiting streamlines in the wing surface may deviate from the mainstream direction by Very large angles. This is, of course, a consequence of the swirling flow around the vortex cores, and the crossflow angles are largest in the region between the attachment lines and the secondary separation lines (see e. g.
Fig. 6.19). J C Cooke (1967) found for laminar flow that a method assuming small crossflow gives only a rough general picture of the flow and is quite inaccurate in the details, especially in the velocity profiles it predicts.
He obtained a much better representation by using a finite-difference method, described in Cooke (1965), and by assuming the flow to be quasi-conical.
Cooke exploited the observed fact that all external streamlines cross a given ray from the apex at a constant angle and assumed that the velocity changes along a ray are small compared with those normal to it, thus making use of the fact that the wing is slender. It was necessary, however, to use the measured properties of the external flow – calculated values are inadequate. Thus much more work needs to be done before we can predict with some confidence the development of even the laminar boundary layer over lifting slender wings.
Measured starting values and external velocities must also be used in calculating turbulent boundary layers. We note that, in many experiments, only the pressure distribution has been measured. For these cases, P D Smith (1973) has developed an approximate method for calculating the external velocity distribution from the given pressure distribution. This calculation can be
carried out simultaneously with that of the boundary layer. Progress in numerical methods has reached a stage where several methods have been programmed to solve the fully-threedimensional boundary-layer equations, and we refer here to the methods by D F Myring (1970), J Cousteix et al. (1971),
P Wesseling & J P F Lindhout (1971), P D Smith (1973) and T К Fannelop &
D A Humphreys (1974). In particular, Smith’s method has been written in a sufficiently general form to be applied readily to real threedimensional flows; it has been tested successfully not only on swept wings (see section 4.5) but also on East’s experiments on a large flat delta wing with s/Л =1/4 at а/к =0.56 ; the momentum thickness is very well predicted; the shape factor of the velocity profiles is well predicted and also the direction of the limiting streamlines in the surface. A tentative conclusion from the analysis of East’s experiments is that, in general turbulent threedimensional flows, the shear stress is not in the direction of the mean velocity gradient. In this test, the external flow was nearly conical within the traversed region, and the streamwise momentum integral thickness appeared to vary almost linearly with distance from the apex. P D Smith (1973) has also given general expressions for calculating the displacement thickness of the boundary layer, on the assumption of conical external flow. The main features of the distribution of the displacement thickness are a very considerable reduction underneath the cores of the vortex sheet, well below the corresponding value for the twodimensional flow along a flat plate, and a very rapid increase as the secondary separation line is approached. Another feature of this boundary – layer flow is that the domain of dependence becomes progressively narrower as the apex is approached so that the flow at any given station becomes less and less dependent upon the starting conditions the further upstream the calculation is started. Physically, this effect can be explained by the fact that the contribution which the flow within the boundary layer at an upstream station makes to the flow within the boundary layer at a downstream station may be very small and that the rest of the flow at the downstream station has been entrained by the vortex sheets from the external flow and is not influenced by the upstream boundary layer. This applies particularly to the flow over the wing outboard of the primary attachment lines, but also to the nearly parallel flow between them.
The next question to be discussed is that of how the state and development of the boundary layer may affect the flow over slender wings. Here, we follow the presentation by J H В Smith (1969). As in the threedimensional boundary layers over swept wings, there are several mechanisms which can bring about transition from the laminar to the turbulent state. J C Cooke (1960) has explained how the region of nearly parallel flow between the attachment lines usually responds to two kinds of mechanism: a twodimensional (Tollmien – Schlichting) instability near the centre line, which gives rise to a transition front CDE in Fig. 6.41 more or less parallel to the attachment lines (shown as dashed lines); and a sweep (Owen-Stuart) instability further outboard, which leads to wedge-shaped fronts ABC and E F G. The existence of such complex fronts has been confirmed in flow observations by J A Lawford (1964). Conditions are more complicated and less predictable in the region with highly-curved flow between the attachment lines and the secondary separation lines. Very roughly, the flow may be expected to remain laminar more readily in the region near the apex because the local Reynolds number is lower there than in the region near the trailing edge, where transition to turbulent flow may occur while the flow is still laminar further upstream. This happens quite frequently in model tests in windtunnels; it has been observed by J A Lawford (1964) and D Hummel (1965) and shown to lead to different spanwise positions of the secondary separation lines’, both may still lie approximately
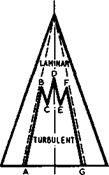 |
Fig. 6.41 Possible instability fronts on a slender wing. After J C Cooke
(1960)
along rays from the apex, but the turbulent separation over the rear of the wing is further outboard because the turbulent boundary layer withstands a greater recompression than the laminar layer. This displacement may be quite large, as can be seen from the results in Fig. 6.42 from tests by P В Earnshaw (1968, unpublished) on a delta wing model which was smooth in some of the tests and roughened in others. When the model was smooth, the secondary separation was laminar over at least 70% of the model length and occurred at у = 0.68 of the semispan; when the model was rough, transition occurred within the first 10% of its length and the secondary separation shifted out to у = 0.79 of the semispan, at the relatively high angle of incidence а/к ■ 1.4. This affects the shape and size of the secondary vortex sheets and hence also the shape of the primary vortex sheets. The example in Fig.
6.42 shows how the position of the vortex core is shifted slightly outward when the wing flow becomes turbulent.
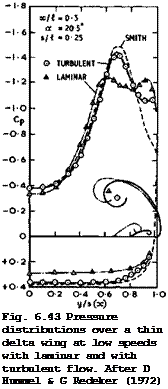
Because of these changes, the state of the boundary layer has its main effect on the pressure distribution over the wing: the ‘induced suction peaks are significantly affected by the shape of the primary vortex sheets and also by the position and strength of the secondary vortex sheets. This is demonstrated clearly by the results of D Hummel & G Redeker (1972) in Fig. 6.43, which shows pressure distributions across a forward station, where the flow may be regarded as conical, for the same wing as in Fig. 6.11. We may assume that the theoretical curve of J H В Smith (1966) is likely to represent the pressures in the absence of any secondary separation. Thus the difference between the dashed line and the measured curve for turbulent flow (circles) indicates the additional suction induced by the secondary vortex sheets.
This difference is much larger when the boundary layer is laminar (triangles): the suction peak induced by the primary vortex sheet is lower and that induced by the now larger secondary vortex sheet is significantly higher. The effects will influence not only the lift but also the drag of slender wings, particularly if these have appreciable thickness or camber near the leading edges.
We understand how these effects come about but we cannot yet predict them. In particular, we cannot be certain what the conditions at full scale on an aircraft in flight will be, and we do not know how to simulate these with confidence in model tests in a windtunnel.
 LIVE GRAPH
Click here to view
Having seen how the state and the development of the boundary layer may affect the pressures and forces on a slender wing, we proceed to discuss the question of what the skin-friction forces are in these flows, through the whole speed range. This is an important question since skin friction may account for about a third of the overall drag of a slender supersonic transport aircraft
(see e. g. the review of practical drag prediction methods by S F J Butler
(1973) , with its extensive bibliography).
Consider first a sharp-edged, symmetrical wing at zero lift. Following ideas of D A Spence (1959), J C Cooke (1963) developed a method for calculating turbulent boundary layers and hence the skin friction on slender wings. He found that the effect of the pressure gradient on the boundary layer is negligible, if the wing is thin enough, and he could then simplify the calculations, while allowing for convergence and divergence of streamlines. Except near the centre line, where streamline convergence causes some extra thickening towards the trailing edge, Cooke found that the relationship between skin friction and Reynolds number based on the local momentum thickness could be taken to be nearly the same as on a flat plate of the same planform. In fact, a power law was used. This makes the determination by means of a ‘strip method’ of the viscous pressure drag and of the skin-friction drag quite simple. К G Smith (1964) has provided charts for applying the method, including means for calculating the ‘wetted area’ of given wings. Comparison with experimental results has shown that the method is quite adequate for simple shapes. When this method is applied to full-scale aircraft, the Reynolds numbers are usually higher than those for which flat-plate data exist. Therefore, recent results obtained by К G Winter & L Gaudet (1971) for Reynolds numbers up to 200 x 10°, based on streamwise length, in low-speed flow (from Mq = 0.2) and up to 100 x 10^ in supersonic flows (up to Mq = 2.8) are especially useful. These tests show that the accepted descriptions of turbulent boundary layers in incompressible flow, derived from the concept of a universal law of velocity defect, are preserved for compressible flows if the boundary-layer parameters are expressed in kinematic form, whereby velocities only are considered. This observation, together with an empirical expression for the effect of compressibility on the skin-friction coefficient, makes it possible to formulate a simple method for calculating the skin friction and the velocity profiles of turbulent boundary layers for flows with constant pressure and without heat transfer. In this context, we mention the fact that, on real aircraft, the surface may not be smooth. For measurements of the additional drag of some characteristic aircraft excrescences, immersed in turbulent boundary layers, we refer to the work of S F Hoerner (1965) and of L Gaudet &
К G Winter (1973) and other references given there. We also mention that, in windtunnel tests, the surface of aircraft models may be made rough intentionally, for the purpose of provoking an early transition to turbulent flow. For a discussion of possible drag increments associated with roughness on slender wings, we refer to the work of D G Mabey (1963) and J Y G Evans (1964).
Consider now the slightly more complicated flow past a thick cambered wing, when the attachment lines still lie along the sharp leading edges. Such flows may be relevant in practice as they may occur near the cruise condition (see section 6.8 below). Mild adverse pressure gradients may then occur, and the convergence and divergence of streamlines is likely to be greater than on a symmetrical wing. By measuring the local skin friction on such a wing (by means of a razor blade technique), К G Winter & К G Smith (1965) discovered large departures from flat-plate flow, so that the theory of J C Cooke (1963) is not adequate in such cases. Even though the overall skin-friction drag still happened to be fairly close to that of a flat plate, local values as low as half that on a flat plate, at the same length Reynolds number, were found in regions where convergence of the flow considerably amplified the effect of a mild adverse pressure gradient. These effects arise as a direct consequence of changes in the velocity profiles – crossflows are obviously no longer small.
The observations have been confirmed by the results of an extensive study by К G Winter et al. (1968) on a body of revolution especially designed to have regions where convergence and divergence, and favourable and unfavourable pressure gradients, are combined in various ways. This study showed that a modified form of the Ludwieg-Tillmann formula can be used in compressible flow and that a calculation method, based on simultaneous integration of the momentum and kinetic-energy equations, gives good agreement with some of the experimental results, but also has some deficiencies. These probably stem from the representation of the velocity profiles by a single parameter (power law) and from inadequate allowances for dissipation and surface curvature.
Their effects have later been investigated by J C Rotta (1967) and (1969), but further work to elucidate some of the uncertainties of the study remains to be done. For practical purposes, numerical methods such as those by P D Smith (1973) may be adequate. However we should be aware that our ability to predict with confidence the behaviour of general threedimensional turbulent boundary layers is still quite limited and uncertain. This has been brought out very clearly by systematic comparisons of the performance of available calculation methods in the valuable ‘Trondheim Trials’, reported by L F East
(1975) . In most methods, adiabatic walls are assumed but some can deal with heat transfer between wall and air. Aerodynamic heating just becomes significant in flight at Mach numbers around 2.
Real gaps in the theory exist when separated flows, as in Fig. 6.19, are to be considered. At present, we have to rely entirely on experiments, and very little information is available.
In the context of effects of viscosity, we refer briefly to some possible sources of unsteadiness in the flow, bearing in mind, that in general terms the slender-wing flow is very steady and stable compared with that over swept wings: phenomena such as stalling or buffeting do not occur on slender wings. Yet some pressure fluctuations on the wing surface have been observed by D A Lovell & T В Owen (1970), which could have significant repercussions on the structural design of the wing, particularly in relation to panel vibration. Substantial fluctuations are confined to a small area immediately inboard of the secondary separation line. The frequency spectrum is such that the high- frequency portion conforms to a scaling law obtained from data on twodimensional turbulent boundary layers and is thus related to the turbulence structure. But there is another amplitude peak at low frequencies (between about fx/VQ = 5 and 10), which is not amenable to such simple scaling. This is most likely to be associated with the fact that the secondary separation line is not fixed in position but may move with time. Similar fluctuations have been found near the separation line in front of forward-facing steps on a flat plate. It was found that the amplitudes and spectrum shapes of these low – frequency portions of the spectra are not strongly dependent on the Reynolds number and increase only slowly with increasing angle of incidence. For general predictions of pressure fluctuations on aircraft surfaces see К G Winter (1974).
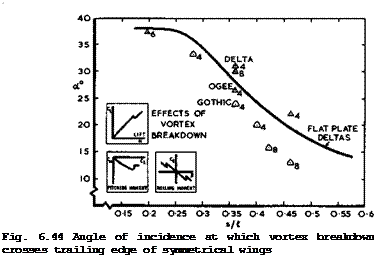
Another unsteady flow phenomenon is the breakdown in the vortex cores, the causes of which have already been discussed above. No effects on the wing’s stability and performance have been observed until the point of vortex breakdown, which moves forward as the angle of incidence is increased, passes the trailing edge. At the angle at which this occurs, small but sudden changes are experienced in the lift and pitching moment and sometimes also in the rolling moment, and there is a rapid rise in the level of pressure fluctuations on the wing surface beyond that described above. Therefore, vortex
breakdown needs to be considered at an early stage in both the structural and the aerodynamic design. Because these effects of breakdown, its precise cause, and how the history of the vortex flow over the wing affects it are only imperfectly understood, the angle of incidence at which the point of vortex breakdown in the cores passes the trailing edge is at present regarded as imposing an operational limit to slender wings. This cannot yet be predicted at all and the information needed must be obtained from experiments. These present their own difficulties because the introduction of probes to measure the vortex structure can easily provoke premature breakdown. Non – instrusive testing with a Schlieren system, for example, gives more reliable results. D A Kirby (1971, unpublished), has collected and evaluated the results from various tests by N C Lambourne & D W Bryer (1960), J A Lawford & P Beavenham (1961), P В Earnshaw & J A Lawford (1961), P В Earnshaw (1964) and (1968), Ph Poisson-Quinton & E Erlich (1965) and W H Wentz & D L Kohlman (1971); his summary of the results in reproduced in Fig. 6.44. The shape of
 LIVE GRAPH
Click here to view the points gives an indication of the wing planform and the numbers give the mean thickness-to-chord ratio. We find that the angle of incidence at which the vortex breakdown position crosses the trailing edge is very high for values of the slenderness ratio s/Я. = 0.25 , and thus well outside the range of practical interest. There is a general, and fairly orderly, trend for this angle to decrease as s/4 is increased, and breakdown occurs earlier the thicker the wings and the fuller the planform shape, as on gothic wings with p > 1/2 . The insets in Fig. 6.44 show schematically the changes in lift, pitching moment, and rolling moment as vortex breakdown reaches the wing. The kinks in the curves are quite small in practical cases and become less pronounced as s/l is increased and the contribution of the leading-edge vortices to lift and moments becomes smaller. Thus any operational limit is imposed on structural rather than aerodynamic grounds.
The results from model tests on vortex breakdown in Fig. 6.44 have been generally confirmed by results from flight tests on the HP 115 research aircraft by L J Fennell (1971). Once the point of breakdown moved across the trailing edge, its distance from the apex of the wing, in terms of the overall length, was found to vary like a“5/2 f on this aircraft with s/й, « 0.25 .
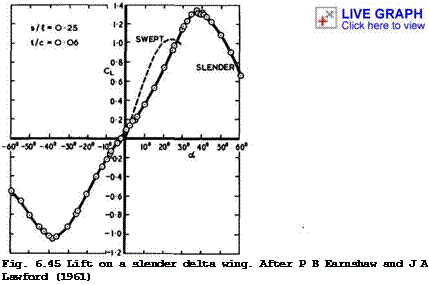 |
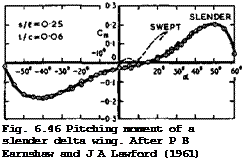
We can now look at the overall forces and moments and the stability characteristics of slender wings at low speeds in some more detail, on the basis of experimental evidence, since the available theories cannot yet provide the information. To supplement the information already given, Figs. 6.45 and 6.46 show measured lift forces and pitching moments on a cambered delta wing
 LIVE GRAPH
Click here to view (with a flat upper surface and a smooth convex lower surface) over a wide range of angles of incidence from a “ -60° to +60° . To put these results into perspective, the dotted lines give results for a swept wing of constant chord with ф = 45°, t/c = 0.06, A – 4 , reproduced from Fig. 4.36. Variations and limitations of lift and moment on the swept wing are quite pronounced, in contrast to the smooth characteristics of the slender wing. This demonstrates once again why swept wings need variable-geometry high-lift devices and tailplanes, and why slender wings do not and can be tailless; it also demonstrates clearly the aerodynamic advantages of slender wings, although, as explained in section 6.2, these cannot be exploited in full in practice because of operational and weight limitations.
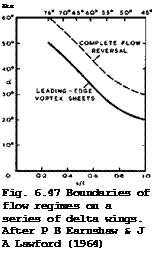
The orderly behaviour of the slender wing stems mainly from the fact that the primary separation lines are firmly fixed along the leading edges at all angles of incidence tested. F В Earnshaw and J A Lawford (1961) found that the flow over the wing of Figs. 6.45 and 6.46 remained of the leading-edge vortex-sheet type (as in Fig. 3.6) up to about a = 50° . At higher angles, the flow changed into a bubble type, with flow reversal setting in near the trailing edge and spreading over the whole upper surface by about a – 60° . Approximate boundaries between these flow regimes for a whole series of similar delta wings are shown in Fig, 6.47. The angle up to which leading-edge
 LIVE GRAPH
Click here to view vortex-sheet flows exist becomes smaller and smaller as s/& is increased and the angle of sweep of the leading edge reduced. Note that the line for vortex breakdown in Fig. 6.44 lies well below the boundary of leading-edge vortex-sheet flow in Fig. 6.47. Note also that С^(а) in Fig. 6.45 has a maximum value. This is associated with the change in type of flow. The normal force coefficient С^(а) also has a maximum value and finally appears to approach a value around 1.2 for а = 90° . But this maximum lift has obviously not the same significance as the maximum lift near the stall of swept wings.
We have already reproduced some general experimental evidence on the lift- dependent drag in Fig. 6.33 and on longitudinal stability and trim in Fig.
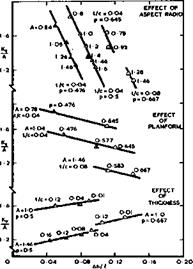
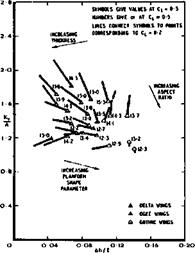
6.24. We can supplement that now by more details on the effects of planform shapeл thickness, and slenderness ratio or aspect ratio A = 2(s/A)/p, on the basis of an analysis by D L I Kirkpatrick & D A Kirby (1971) of low-speed tests on a large number of wings by D A Kirby (1967), D L I Kirkpatrick (1968), D A Kirby & D L I Kirkpatrick (1969) and A G Hepworth (1971). In Figs. 6.48 and 6.49, the lift-dependent drag factor is plotted in the form KyYA = ірКу/^Д) against the distance Ah of the aerodynamic centre ahead of the centre of area, measured in terms of the overall length і. Each point is indicated by a symbol which crudely represents the planform shape: delta, gothic or ogee. All the data in Fig. 6.48 are for Cj, = 0.5 . It deals in three parts separately with variations of one of three parameters – aspect ratio^ planform shape parameterл and thickness to-chord ratio – while the other two are kept constant. Each symbol is labelled with the value of the varying parameter and each line of symbols with the values of the
|
![]()
 |
 |
Design of Supersonic Slender Aircraft
Fig. 6.48 Drag and stability of Fig. 6.49 Lift, drag and stability of
slender wings at = 0.5 slender wings. After D L I Kirkpatrick
& D A Kirby (1971)
parameters which are constant along it. Delta wings have been omitted in the middle of Fig. 6.48 because their pointed tips give rise to anomalous variations. The symbols in the three parts of Fig. 6.48 have been superimposed in Fig. 6.49. The arrows indicate trends with increasing aspect ratio, thickness, and planform shape parameter noted from Fig. 6.48, and the parameters of the individual wings can be recovered by reading across. The labels beside the symbols are now the angles of incidence at which the lift coefficient of 0.5 is achieved. The line drawn from each symbol connects it to the point on the plot which corresponds to the same wing at a CL-value of 0.2. Thus a simultaneous and comprehensive presentation is achieved of certain basic characteristics affecting performance (Ky/A) , usable lift (a for Cl = 0.5) , balancing difficulty (AhA) , and trimming difficulty (Ah(Cl = 0.5) – Ah(CL = 0.2)) . These data may be used to estimate the properties of similar wings, but it is not claimed that the characteristics are the best that can be achieved, even with uncambered wings.
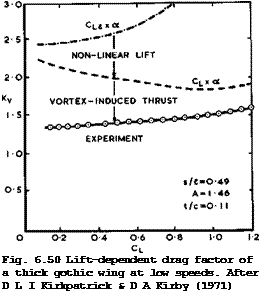
It is not yet possible to provide full explanations for these effects on theoretical grounds, but some are at least physically plausible. Consider, for example, the effect of thickness on a particular gothic wing as tested by D L I Kirkpatrick & D A Kirby (1971). Fig. 6.50 gives an indication of how the measured drag comes about; it is much lower than it would have been if there had been only a linear lift force Cl£ normal to the chordal plane (Cl£ x ot) ; it is also less than it would have been if the actual lift force had been normal to the chordal plane (Cl x a) . Thus both the non-linear lift component and the thrust force induced by the leading-edge vortex sheet on the forward-facing surfaces of the thick wing substantially reduce the lift-dependent drag below that given by linear theory in the absence of suction forces. This illustrates also the severe demands which a good theory has to meet.
 |
Similar effects of wings thickness were found by D A Kirby & D L I Kirkpatrick
(1969) on a series of delta wings with thickness-to-chord ratios varying from 0.04 to 0.16. On the assumption that the normal force and the pitching moment can be split into linear and non-linear components, they found that:
(1) a reduction in overall lift occurs as wing thickness is increased; the linear component of the normal force falls and also the non-linear component, in keeping with the similarity laws discussed above;
(2) with increasing wing thickness, the suction forces induced by the leading-edge vortex sheets have an increasingly large forward component in the plane of the wing and, consequently, the lift-dependent drag of a thick slender wing is less than that of a thin wing with the same planform;
(3) the point of action of the linear component of the normal force appears to move forward with increasing thickness but that of the non-linear component appears to move rearward; this might explain why the longitudinal stability
is reduced with increasing thickness at low lift coefficients and increased at high lift coefficients appropriate to take-off and landing.
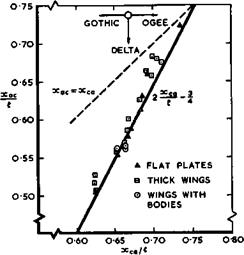
We have already seen from the results in Fig. 6.24 that the planform shape strongly affects the position of the aerodynamic centre. Further results, based on low-speed data for uncambered slender wings, are presented in a form suggested by Messrs. Handley Page in Fig. 6.51 (after A Spence & D Lean (1962)). These confirm that the planform shape, expressed here simply by the position of the centre of area (xca) , does indeed largely determine where the overall lift force acts. For crude estimates, the simple relation
|
Fig. 6.51 Position of the aerodynamic centre at low speeds and Cl – 0.5 . After A Spence and D Lean (1962) |
may be used. These results also explain why it is safety at take-off and landing, when the aerodynamic centre is at its most forward position, which largely controls the choice of planform: for trim and stability considerations, the aerodynamic centre should be behind the centre of gravity (but not too far behind in view of the fact that it moves aft at supersonic speeds). In turn, the centre of gravity of a thin wing is likely to be close to the centre of area of the planform. Thus a balancing problem, in positioning all the weight items, exists since the results in Fig. 6.51 show the aerodynamic centre to lie ahead of the centre of area. This problem is least severe for ogee planforms.
One way of solving this balancing problem is to apply a small degree of sweep – back to the trailing edge. According to experimental results obtained by D L I Kirkpatrick & A G Hepworth (1970), even a small angle of sweepback of 15° may reduce the distance Ah/£ between the aerodynamic centre and the centre of area by about 1% to 2% of the overall length. The lengthwise position of the engines may also be used to some extent to adjust the centre of gravity. Further, the volume distribution may be used for the same purpose if the wing is thick and the payload housed within the wing. Lastly, a fuselage protruding ahead of the wing may ease the balancing problem. As shown by D A Kirby (1967), the changes in the aerodynamic properties brought about by a fuselage need not always be detrimental, especially if we restrict ourselves to wing-fuselage combinations with £.W/Z = 0.8 or more, i. e. to relatively short fore-bodies, as we found to be desirable from the results in Fig. 6.7. Finally, bringing the centre of pressure ahead of the aerodynamic centre requires the application of camber; this will be discussed in sections 6.6 and 6.8.
Whe considering the lateral stability and control characteristics, we must remember that the wings are not only aerodynamically slender but also inertially slender, i. e. the moments of inertia about the pitch and yaw axes
are much greater than that about the roll axis. Thus it was a matter of concern from the beginning that:
(1) rolling moments due to sideslip might be large at high angles of incidence, because the vortex sheets will then move relative to the wing and with them the suction peaks, lifting the upwind side more than the downwind side;
(2) the response to such rolling moments might be unusually rapid and lead to oscillatory motions;
(3) lateral control by ailerons might not be adequate because the span is small.
Such conditions might be set up especially during an approach in a crosswind or in flight through sidegusts. As we shall see, fears that these and other related properties of slender aircraft might lead to unacceptable flight characteristics turned out to be unfounded, but only after a great deal of work had been done. This work covered all aspects of the problem, from theoretical studies of the lateral motion and response (see e. g. В Etkin
(1959) and W J G Pinsker (1961)), and of the various derivatives involved (see e. g. A J Ross (1961)), to windtunnel measurements of steady characteristics (see e. g. J В Scott-Wilson (1958), M В Howard (1958), and J К Harvey
(1960) ), and of oscillatory derivatives (see e. g. J S Thompson & R Fail (1966) and J S Thompson et al. (1969)), to the testing of free-flight models (see e. g. R Fail (1972), A J Ross et al. (1973), and G H Greenwood & G F Edwards
(1974) ), and to full-scale flight testing of two research aircraft, the HP 115 (see e. g. J M Henderson (1965) and P L Bisgood & R L Poulter (1972)), and the ВАС 221 (see e. g. R Rose (1961), F W Dee & 0 P Nicholas (1964), and R Rose et al. (1967)). An extensive survey of derivatives in rolling motion has been given by F Schlottmann (1974). Further details will be discussed in section 6.9. We note also that AGARD has specified the shape of particular slender wings as calibration models for dynamic stability tests (see R Fail ft H C Garner (1968)), and valuable results have been obtained for them.
What may be described as the most dramatic of the possible lateral motions is the Dutch roll oscillation about an axis above the centre line of the aircraft, which itself swings periodically and points slightly to port and then to starboard and then back again. This was first observed on delta-wing models in a free-flight windtunnel by M 0 McKinney & H M Drake (1948) and interpreted as an instability which would make such wings unflyable at CL~values beyond about 0.5 for s/Я. = 0.25 . The onset was observed at an angle of incidence as low as about 10° on a wing with s/l near 0.25. This seemed difficult to understand, and so W E Gray (1958) and (1964) carried out dynamic tests on a series of free-flying models, with results which were much more favourable, as can be seen from Fig. 6.52. These results changed the whole picture radically and opened up the way for the evolution of slender supersonic transport aircraft. Gray’s results were confirmed by many other windtunnel and flight tests, which have already been referred to above. It emerged that the Dutch roll of slender wings does not present a serious problem. D W Partridge ft В E Pecover (1969), using the windtunnel-based flight-dynamic simulator of L J Beecham (1961), showed that this particular oscillatory behaviour is a direct consequence of the non-linear aerodynamic characteristics of slender wings. They found that, below a certain trim angle of attack, the Dutch roll is convergent in the conventional manner. Above a critical value, which corresponds to that at which the motion would have been dynamically unstable if the aerodynamics
|
Fig. 6.52 Angle of incidence at which lateral oscillation may start. After W E Gray (1958) |
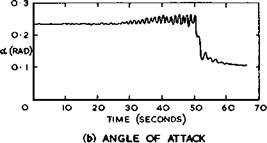
had been linear, a limit cycle, that is, a sustained oscillation in sideslip and bank angle, develops, the amplitude increasing as the angle of attack is increased further, as indicated by the example in Fig. 6.53. By reducing the trim angle of attack to below the critical value, the sustained oscillation can be eliminated, and such a recovery is shown in Fig. 6.53. This behaviour can now be explained also on theoretical grounds in terms of the non-linearity of the yawing moment with sideslip. On slender wings the Dutch roll is an almost pure rolling oscillation, which should be easier to control than the coupled motion in roll and yaw which occurs in the classical Dutch roll. All these findings have been fully confirmed by flight tests. It has been possible to fly the HP 115 aircraft (with s/Я 0.25) up to angles of incidence of nearly 40°. J M Henderson (1965) describes how, at some high angle of incidence, the oscillation can be triggered off by a rudder or aileron pulse or by some external disturbance. If the controls are then kept fixed, the bank amplitude builds up over some 8 to 12 cycles until it reaches some ±30° in a sustained oscillation which is neither unpleasant nor disturbing to the pilot. What is even more important, the motion can be quickly and comfortably corrected and completely suppressed by normal use of lateral controls. This is a shining example of the value of independent enquiry and perseverance in aimed research: a phenomenon which might have prevented the practical application of slender wings was understood and resolved, and in a most satisfactory manner.
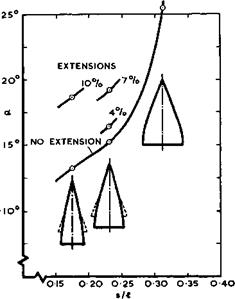
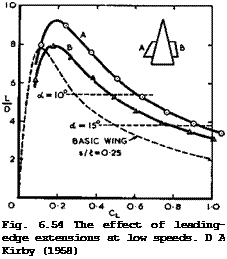
Fig. 6.52 includes some results for wings with leading-edge extensions which are seen to be an effective means of raising the angle for the onset of lateral oscillations still further. Such extensions have been proposed and tested by D A Kirby (1958). They are flat thin surfaces extending sideways from a basic wing and may be thought of as variable-geometry devices to be
extended only at low speeds. They give a percentage lift increment which, at a = 15°, is about twice the percentage increment in area. The results in Fig. 6.54 show that they also improve the lift-to-drag ratio in a manner which was shown to be desirable in section 6.2 in connection with Fig. 6.2. The fore-and-aft position of the extensions can be arranged to give either no change in the static stability margin; or no change of trim; or any required small change of trim or static stability. Further, extensions may reduce the
 |
 |
LIVE GRAPH
Click here to view
After
rolling moment due to sideslip to about 0.6 that of the basic wing. The best results were obtained, with an orderly and stable flow, when the inboard part of the leading edge of the extension was swept forward through a moderate angle (unlike the unswept leading edges in the examples in Fig. 6.54). In this case, there are three vortex sheets and cores on either side of the wing: one from the front part of the main wing; another from the sweptback edge of the extension, both with vorticity turning in the ordinary sense; and a third weaker core from the sweptforward edge of the extension, which turns in the opposite sense. The third core appears to prevent the other two from rolling around one another, and the three of them form a stable combination – a nonage & trois – that seems to work. Kirby’s leading-edge extensions may present some structural problems which have not been resolved; they have not yet been applied in practice.
Of the lateral derivatives, the rotting moment due to angte of sidestip
3, = ЭС*/Э6 > is probably the most important and its variation with
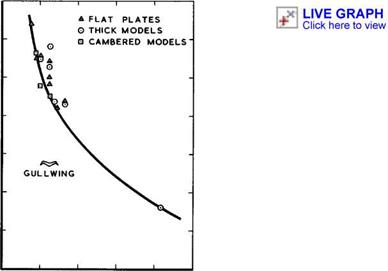
slenderness ratio s/A the most typical of slender wings. Some experimental results are given in Fig. 6.55, from a collection of data by A Spence &
D Lean (1962). – lv increases very steeply as the slenderness ratio s/% is
![]()

![]()
![]()
![]()
![]()
![]()
 0*35
0*35
decreased, and, for a given wing, it is roughly proportional to the lift coefficient. s/£ is evidently the dominant parameter, but thickness may increase the value of -£v • Several means are available for reducing the rolling moment due to sideslip, should that be required. Kirby’s leading – edge extensions have already been mentioned. Bearing in mind the nature of the flow, we should expect large benefits from a downward deflection of the wing tips. This was confirmed by windtunnel tests by W J G Trebble &
D A Kirby (1967). Such anhedral may cause a ground-clearance problem at takeoff and landing, but this can be alleviated without losing its benefits by
Next Page
giving some dihedral to the inner part of the wing. This leads us to a nonconical form of gullwing. One of the models tested by Trebble & Kirby had a delta planform with s/l = 0.25 , a deflection of 40° of the tip outboard of 0.75 of the semispan, and 10° dihedral applied to the inner wing so that the wing tips were no lower than the trailing edge at the centre line. This gave a reduction of about one-third in the magnitude of the rolling moment derivative below that of the plane wing, as shown in Fig. 6.55. Thus, once again, one of the few undesirable characteristics of slender wings can be controlled and moderated by design, although this particular principle has not yet been applied in practice.
Because of the vortex flow over slender wings, the forces on the fin are important in determining the overall lateral characteristics. Early tests by D H Peckham (1958) established quite firmly that a central fin is to be preferred: if two fins are placed substantially outboard of the centre line or at the wing tips, they may interfere with the vortex sheets from the leading edges in an unfavourable and uncontrollable manner. The contributions of central fins, on the other hand, have been shown in several experiments (see e. g. M В Howard (1958, unpublished A V Roe Report) and G H Greenwood et al.
(1974) ) to be orderly and predictable, in agreement with calculations assuming full reflection in the wing, and also to be sensibly constant up to angles of incidence of at least 25°.
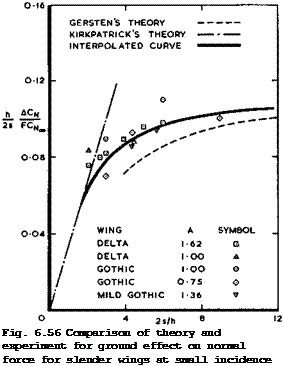
Another characteristic of slender wings which turned out to be entirely favourable is the ground effect, quite unlike the much more complicated and as yet unresolved ground effect on swept wings (see e. g. F Thomas (1958) and section 5.7). For wings at a small angle of incidence for the case when the span 2s is large as compared with the height h from the ground, К Gersten & J van der Decken (1965) produced an adequate theory for the lift increase caused by the ground proximity. This was extended by D Hummel (1973), who found satisfactory agreement between calculated and experimental results obtained by H John (1965). Gersten’s theory was complemented by a semiempirical method by D L I Kirkpatrick (1969) for the case when the span is small as compared with the height from the ground. With the help of results for these two limiting cases and of various experimental results, e. g. by D H Peckham (1957) and by L F East (1967) and (1970), it is possible to draw an interpolating curve, as shown in Fig. 6.56, which is given by
ACN /2s V-4
c~ = °-045F X * <6-44>
N" ‘ ‘
where ACjg is the increment in normal force, Сцоо is the normal force away from the ground, h is the height of the mean quarter-chord point above the ground, and F = (2/тгА) (dCjj/dct),» is a correction factor for the assumptions of slender-body theory. This approximation is based on the observation that measured values of АСц/Сцсо, at given values of 2s/h, do not depend on the angle of incidence. Kirkpatrick used the same technique to derive a similar correlation of data for the effects of ground proximity on the pitching moment. The extra lift due to ground effect and the induced nose-down pitching moment are particularly useful during the landing flare. In addition, there are powerful and again favourable lateral effects: windtunnel tests by T В Owen
(1968) , in which a slender model was banked and oscillated in roll over a groundboard, showed not only the existence of quite a strong roll constraint but also a marked increase in roll damping as the ground is approached. Theoretical investigations by W J G Pinsker (1970) showed that, in the crucial
|
![]()
Design of Supersonic Slender Aircraft
period just before touchdown, the lateral characteristics of slender aircraft are completely dominated by ground effects in a very favourable way: for example, the wing tends to level up near the ground even in severe turbulence, and hardly any aileron control deflection is required in a crosswind if the aircraft is allowed a slight amount of bank angle. These results have been fully confirmed by flight tests: a well-designed slender aircraft may 1and 1itself,


