Comparisons of Vortex Wake Models with Experimental Data
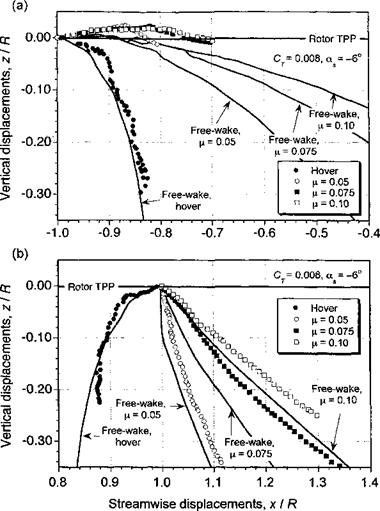
To demonstrate some aspects of the predictive capabilities of free-vortex wake models, comparisons are now shown with experimentally determined wake geometries in hover and forward flight. Figure 10.38 shows a comparison of predicted and experimental wake boundaries at the longitudinal centerline of the rotor (see also Fig. 10.10). It can be seen that during the transition from hover to forward flight, there are significant changes to the wake geometry, and so these cases provide a good general test of the capabilities of any vortex wake model, free or prescribed.
In hover, the wake is (theoretically) axisymmetric: so the leading- and trailing-edge wake boundaries are identical. For a variety of reasons, this is not necessarily the case for the experimental measurements, but the overall differences are small. As the advance ratio is increased, note that the wake is quickly skewed back by the free-stream flow. Figure 10.38 shows that as the newer tip vortices at the front of the rotor disk move downstream, they are convected over the top of the following blade. As the vortices are convected further downstream, they begin to descend toward the TPP and are ultimately intersected by a blade producing a perpendicular type of BVI.
At the rear of the rotor disk, however, there is a higher downward induced velocity component, and the vortices remain well below the TPP. As a consequence, the wake skew angle at the rear of the disk is much smaller than at the leading edge of the rotor. It can also be seen from Fig. 10.38 that while the free-vortex wake model shows a high sensitivity to small changes in advance ratio, the streamwise displacements are somewhat underpredicted compared to the experimental results. Some of these differences, however, can be attributed to experimental uncertainties in the measured data. Overall, the results from the free-vortex wake model are found to be in much better agreement with the measurements than are those of the rigid wake representation.
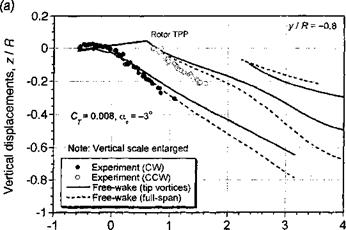
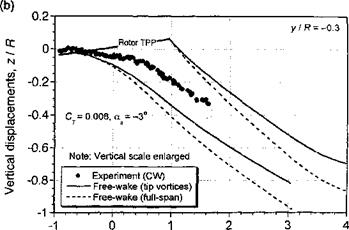
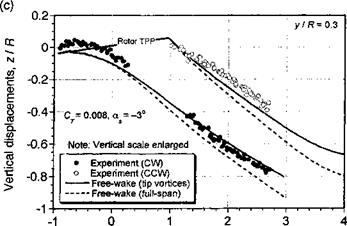
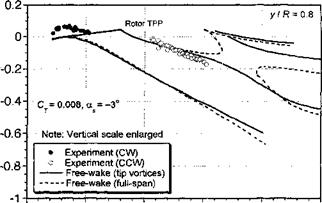
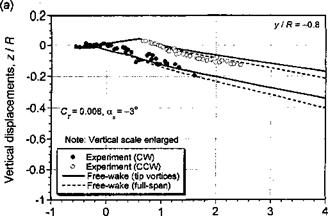
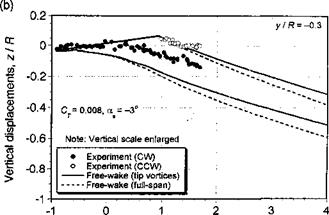
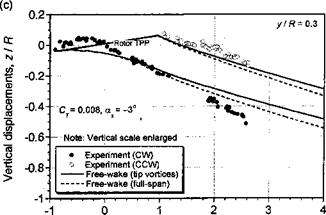
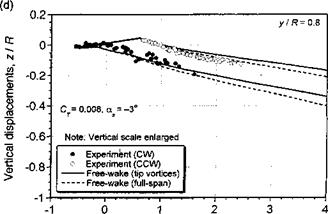
Further comparisons of the free-vortex wake model with measured tip vortex displacements in the x-z plane are shown in Figs. 10.39 and 10.40 for two advance ratios and for four longitudinal planes through the wake. The data have been taken from Ghee & Elliott
(1995) , who have measured the displacements of the tip vortices using a planar laser sheet technique. Data were measured at four longitudinal planes at y/R = ±0.3 and y/R = ±0.8. At the inner locations, some gaps occur in the measured data because the fuselage and rotor hub blocked access for flow visualization. Free-vortex wake predictions have been made using both a full-span vortex sheet, and just with the tip vortex alone. We see that for both advance ratios, the free-vortex wake prediction are in good agreement with the measured
|
Figure 10.38 Predicted wake boundaries in hover and forward flight using free-vortex wake scheme compared to measured data, (a) Front of rotor, (b) Rear of rotor. Four-bladed rotor, with CT = 0.008 and = —3°. Data source: Leishman & Bagai (1991). |
tip vortex displacements. Clearly there are some difference between the predictions and experiment, but the overall quality of the results are good, bearing in mind the complexity of the physical problem. The effect of including a full-span wake compared to a single-tip vortex is relatively small, so its inclusion may not be justified given that the numerical cost of this approach is greater by about one order of magnitude. However, the inclusion of the inner wake sheet may be required to ensure proper predictions of rotor performance.
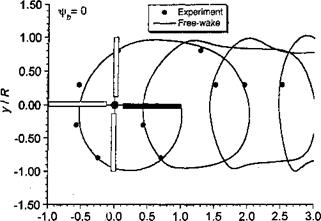
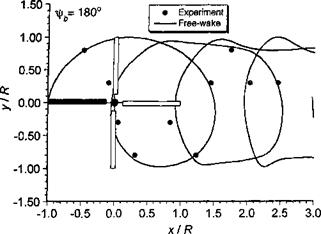
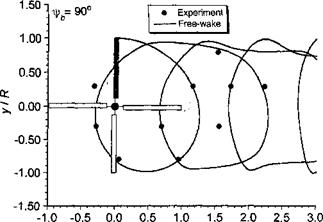
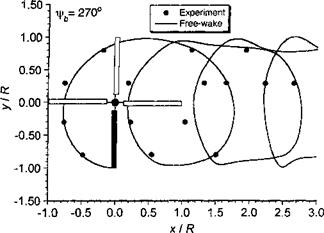
Figures 10.41 and 10.42 show the plan and rear views of the rotor wake at an advance ratio of 0.15. The tip vortex trajectories trailed from each blade have been plotted separately to ensure clarity. Again, the results are compared with the measured tip vortex displacements as the vortices intersect the four longitudinal planes. When viewed from above, the trajectories are relatively undistorted from their epicycloidal forms. It is only at the lateral edges of the wake that distortions occur because of the roll-up between individual vortices. The rear
![]()
|
|
|
Streamwise displacements, х / R
Streamwise displacements, x / R
Figure 10.39 Predicted wake boundaries in forward flight compared to measurements, /z = 0.15; CT = 0.008;a* – 3°. (a) y/R = —0.8, (b) y/R = —0.3, (c) y/R = 0.3, (d) y/R = 0.8. Data source: Ghee & Elliott (1995). (
|
Streamwise displacements, x / R
Streamwise displacements, x / R
Streamwise displacements, x / R Streamwise displacements, x / R
|
|
|
|
|
|
|
||
 |
|||
|
|||
|
|||
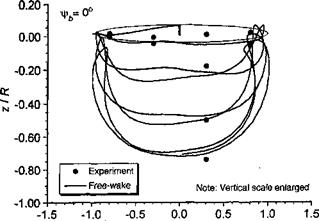
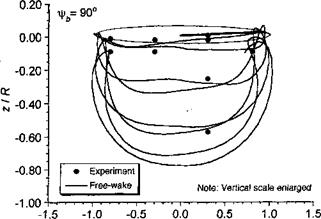
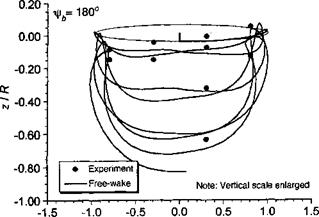
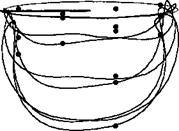

Figure 10.42 Predicted rear view of rotor tip vortex geometry compared to measurements, (a) xlrb = 0°. (b) – фь = 90°. (c) fb = 180°. (d) == 270°. ft = 0.15; Ct — 0.008; as — 3°. Data source: Ghee & Elliott (1995).
![]()
views of the wake shown in Fig. 10.42 vividly show this roll-up process and the formation of vortex bundles or “super-vortices,” a phenomenon previously mentioned in Section 10.4. In these regions, the small radius of curvature of the vortex filaments requires a relatively small levels of discretization; the present calculation has used A^ = Afrw = 5°, and the good correlations obtained with the measured data in these regions confirms that, at least in this case, this is an adequate level of discretization.


