Our heavyweight helicopter equal in the world does not have
In Rostov started production of the most load-lifting rotary-wing car The Russian holding «Helicopt[...]

Everything about aircrafts and helicopters. News and events in aviation worldwide. Civil, transportation, military helicopters and airplanes.

Everything about aircrafts and helicopters. News and events in aviation worldwide. Civil, transportation, military helicopters and airplanes.

Everything about aircrafts and helicopters. News and events in aviation worldwide. Civil, transportation, military helicopters and airplanes.

Everything about aircrafts and helicopters. News and events in aviation worldwide. Civil, transportation, military helicopters and airplanes.


2.9.1 Basic Envelope
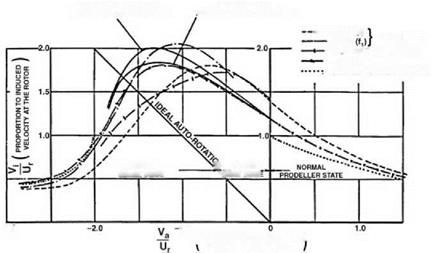
It is of interest to know how the induced velocity varies through all the phases of axial flight. For the vortex ring and turbulent wake states, where momentum theory fails, information has been obtained from measurements in flight, supported by wind tunnel tests [2-5]. Obviously the making of flight tests (measuring essentially the rate of descent and control angles) is both difficult and hazardous, especially where the vortex ring state is prominent, and not surprisingly the results (see Figure 2.21) show some variation. Nevertheless the main trend has been ascertained and what is effectively a universal induced-velocity curve can be defined.
![]()
HOVERFLY I BY BLADE
![]() 1.0
1.0
/PROPORTIONAL TO AXIALY
VELOCITY OF ROTOR
Figure 2.21 Experimental test results for axial flight
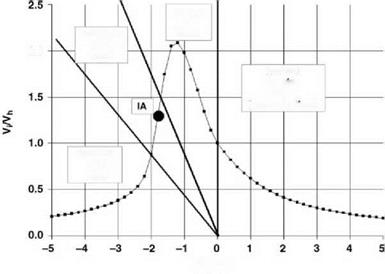 This is shown in Figure 2.22, using the simple momentum theory results of Equation 2.55 in the regions to which they apply. We see that on moving from hover into descent the induced velocity increases more rapidly than momentum theory would indicate. The value rises, in the vortex ring state, to about twice the hover value, then falls steeply to about the hover value at entry to the windmill brake state.
![]()
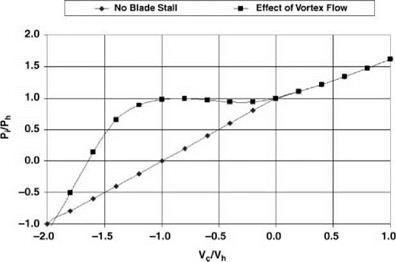
|
The power required to maintain thrust in vertical descent generally falls as the rate of descent increases, except that in the vortex ring state an increase is observed (Figure 2.23). The effect appears to be caused by stalling of the blade sections during the violent vortex-shedding action. The increase can be potentially hazardous when making a near-vertical landing approach under conditions in which the engine power available is relatively low, as would be the case under high helicopter load in a high ambient temperature.