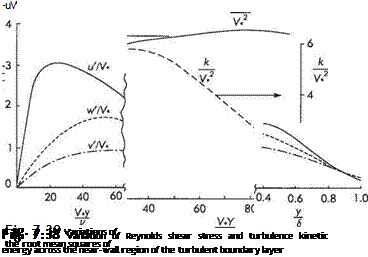
Distribution of Reynolds stresses and turbulent kinetic energy across the boundary layer
Figure 7.38 plots the variation of Reynolds shear stress and kinetic energy (per unit mass), к = (і/2 + Vа + wa)j2 across the boundary layer. What is immediately striking is how comparatively high the levels are in the near-wall region. The Reynolds shear stress reaches a maximum at about y+ ~ 100 while the turbulence kinetic energy appears to reach its maximum not far above the edge of the viscous sub-layer.
Figure 7.39 plots the distributions of the so-called turbulence intensities of the velocity components, i. e. the square-roots of the direct Reynolds stresses, г/2, va and wa. Note that in the outer part of the boundary layer the three turbulent intensities tend to be the same (they are ‘isotropic’), but they diverge widely as the wall is approached (i. e. they become ‘anisotropic’). The distribution of eddy viscosity across
 |
Iа, v’2 and wa across a turbulent boundary layer
the turbulent boundary layer is plotted in Fig. 7.40. This quantity is important for engineering calculations of turbulent boundary layers. Note that the form adopted in Eqn (7.112) for the near-wall region according to the mixing-length theory with £m cc у is borne out by the behaviour shown in the figure.
If a probe were placed in the outer region of a boundary layer it would show that the flow is only turbulent for part of the time. The proportion of the time that the flow is turbulent is called the intermittency (7). The intermittency distribution is also plotted in Fig. 7.40.


