FLOW OVER WINGS AT HIGH ANGLES OF ATTACK
Many airplanes and other vehicles that use lifting surfaces face situations where a variable range of lift coefficient is required. For example, the lowest landing speed of a high-speed airplane is dictated by the highest (safe) lift coefficient. This is even more pronounced for supersonic aircraft, which must have swept leading edges (less than the Mach cone) and small wing area for supersonic cruise, but for landing at reasonably low speeds require very high lift coefficients. Therefore, it is very important to be able to generate high lift coefficients, even if wing stall is approached.
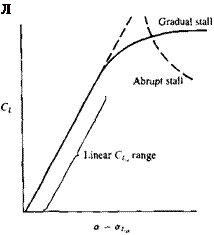
Since the primary function of wings is to generate lift, let us observe a typical lift curve of a wing, as shown in Fig. 14.26. At the lower angle of attack range (far from the stall angle) the lift slope versus angle of attack is well defined and predictable (linear CL<_ range in Fig. 14.26) and airplane lift can be controlled by changing a. However, when the angle of attack approaches the
 FIGURE 14.26
Lift curve and stall characteristics of two generic wings.
stall condition the wing lift will not react to a changes with the same intensity as in the so-called linear range. From an airplane point of view the stall should be gradual, as shown by the solid line, and not abrupt as indicated by the dashed line. Even more important is that the stall process will not generate strong rolling moments due to asymmetry (as a result of an earlier stall of either the left or the right wings) such that the airplane will be driven into a stall-spin.1418
A desirable wing stall pattern can be tailored by having larger section lift coefficients near the wing root. If this is done properly, stall will be initiated there and will gradually spread toward the wing tips, so that the overall stall will be similar to the solid line in Fig. 14.26. Additionally, local wing root flow separations at the beginning of the wing stall yield reasonably controllable rolling moments (assuming that roll control surfaces are located near the wing tips) and such an airplane can safely approach wing stall. This onset of root stall can be obtained by forward wing sweep (see spanwise loading of such wings in Fig. 12.17), by wing twist, etc. On the other hand, the effect of wing taper (see Fig. 12.19) or aft-sweep (Fig. 12.17) results in higher wing tip loading, which (if not corrected by twist, airfoil camber variation, etc.) can cause the high angle of attack flow separations to begin near the wing tips. This may cause a stall of the ailerons and loss of the aircraft lateral control.
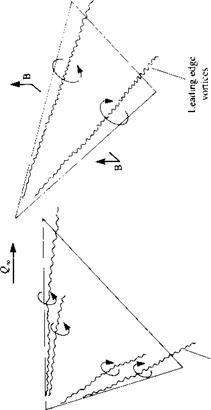
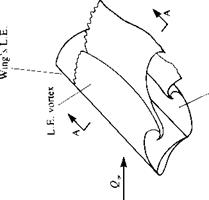
Leading edge sweep also has an important effect on the stalled flowfield over wings. This is illustrated schematically in Fig. 14.27, where typical separated flow patterns as observed by flow visualization are shown for unswept, moderately swept (up to 60°), and highly swept wings. (Note that the discussion in this section is focused mainly on airplane wings where the Reynolds number is considered to be high, e. g., Re > 106.) The unswept wing, shown in the left hand side of the figure, at large angles of attack behaves like a flat plate with two shear layers emanating from the leading and trailing edges. In the two-dimensional view of section AA, a time-dependent vortex shedding (sometimes called a “Karman vortex street”) is observed. In the case of the highly swept wings, shown in the right hand side of the figure, the cross-section flow field is shown schematically in section BB, and the flow separates at the two leading edges, resulting in two strong, concentrated vortices. These leading-edge vortices are located near the leading edge and the low pressure caused by the velocity induced by these vortices increases the wing’s lift. In the case of moderate leading-edge sweep, as shown in the center of Fig. 14.27, the leading-edge vortex becomes less visible, and sometimes even two such vortices per side may be observed.1419
At this point we must emphasize that the methods discussed in Chapters 2-13 are based on potential flow and they are applicable (with some viscous corrections, as in Section 14.2) to attached flows only. The drag force D in a real viscous flow, for example, will have a potential flow component Ц (which was zero in two dimensions) and a viscous flow part Д,:
|
|
|
|
|
|


In attached flows most of the viscous drag is due to the skin friction; however, in the case of extensive separations the drag is due to “form drag” or “pressure drag,” which is much larger. (As an example, consider the case of a fully stalled airfoil where the attached lifting flow pattern is spoiled by a large separation bubble with a fairly constant negative pressure distribution.) For further information on the fluid dynamic drag of a particular configuration it is advised first to search through the considerable collection of experimental data provided in Fluid Dynamic Drag by Hoerner.1420
The analytical treatment of separated flow fields in order to determine the resulting pressure distribution is far more difficult and has not yet reached the level of confidence obtained for attached flows. Consequently, in the following four subsections, experimental evidence is provided on the problems of unswept and highly swept leading-edge separation along with some simple models for some special cases of flow separation. All of these simple models are in their early state of development and have not reached a level where they can be used as a predictive engineering tool (e. g., similar to some panel methods used within the attached flow domain). However, their importance lies in helping to understand and to explain some fairly complex flow phenomena.


