Impinging Jets
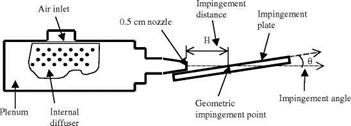
Using PSP and TSP complemented with Schlieren flow visualization, Crafton et al. (1999) studied subsonic jets and sonic under-expanded jets impinging on a flat plate at an oblique incidence angle from a converging nozzle. Results were obtained on two geometric configurations at the impingement angles of 10o and 20o and the impingement distances of 3.8 and 4.5 diameters of the jet, respectively. The jet velocity was varied from Mach 0.3 to Mach 1.0. PSP was used to measure the pressure distributions, and TSP to measure the distributions of temperature and the heat transfer coefficient on the impingement surface. Figure 9.57 shows the jet and impingement plate configuration. The jet facility consisted of a 5-in diameter by 12-in long settling chamber with a 1.5-in radial inlet and a 5-mm diameter nozzle with a 15o convergence angle. The settling chamber was instrumented with a J-type thermocouple to monitor the total temperature of the jet; the total pressure was set using a regulator and monitored using a 0.2 psi resolution Heise pressure gauge. Compressed air was supplied to the nozzle from an air compressor system. The impingement plate was an 8-in high, 12-in long and 1.5-in thick aluminum plate. The normalized geometric impingement distance (H/D) and the impingement angle (0 were varied independently to produce multiple impingement configurations. The impingement angles of 20o and 10o were tested, where 90o corresponded to normal impingement. The geometric impingement distance (H) was four jet diameters. The coordinate system (S, Y) on the impingement plate was defined in such a way that the origin coincided with the geometric impingement point, the 5-coordinate was along the surface of the impingement plate in the mainstream direction, and the У-coordinate was along the surface of the impingement plate in the cross-mainstream direction.
|
Fig. 9.57. Schematic of an obliquely impinging jet test facility. From Crafton et al. (1999) |
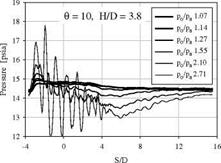
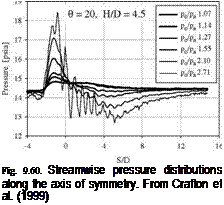
In experiments, Ru(dpp) in RTV was used as PSP and Ru(bpy) in model airplane dope was used as TSP. PSP and TSP, coated on the surface of the impingement plate, were excited to luminesce by a blue LED array at 460 nm. The luminescent emission, filtered using a long-pass optical filter (>570 nm) to eliminate the excitation light, was detected using a 16-bit Photometrics CCD camera. A ratio between the flow-on and flow-off reference images was converted to pressure or temperature using a priori calibration relations. The temperature distribution on the impingement surface in a sonic jet is shown in Fig. 9.58 for H/D = 3.8, в= 10o and p/pa = 2.7, where pa is the atmospheric pressure. The surface temperature varied by less than 0.5oC from the region outside of the influence of the jet to any location inside the region of jet impingement. This temperature difference would result in an error of about 0.1 psi in PSP measurements if the temperature effect of PSP was not corrected. Figure 9.59 shows the pressure distribution obtained using PSP at H/D = 3.8, в= 10o and p/pa = 2.7. The pressure pattern associated with shock cells in the sonic jet was clearly visualized. The pressure on the impingement plate varied by more than 8 psi, suggesting that the temperature-induced PSP measurement error was less than 3% of the full range of pressure. Figure 9.60 shows the streamwise pressure distributions for different total pressures (p/p) of the jet at the impingement angles of 10o and 20o. The subsonic pressure distributions showed a single pressure peak at the stagnation point. This peak pressure location changed with the impingement angle. The first pressure peak in the multi-peak pressure distributions of the sonic impinging jet coincided with the single peak in the subsonic pressure distributions. The first pressure peak corresponded to the stagnation point. In these cases, the first pressure peak location (the stagnation point) was always found somewhere upstream (toward the nozzle) of the geometric impingement point. In fact, the deviation of the stagnation point from the geometric impingement point is an intrinsic property of the non-orthogonal viscous stagnation flow (Dorrepaal 1986; Liu 1992). Theoretically, this deviation decreases to zero as the impingement angle approaches to 90o. Crafton et al.
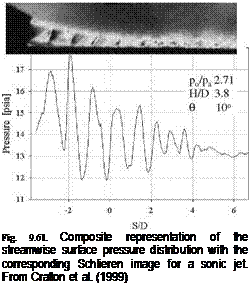
(1999) discussed a correlation of the peak pressure location with the geometric impingement point, which was related to the impingement distance H and the impingement angle в. An insight into the multi-peak pressure distribution was gained by Schlieren flow visualization. Figure 9.61 shows a composite representation of the streamwise pressure distribution and Schlieren image for the sonic jet impinging at 10o. The locations of the shock waves corresponded to the pressure peaks on the impingement surface.
|
|
 |
 |
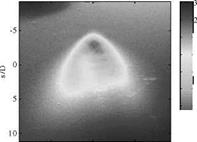
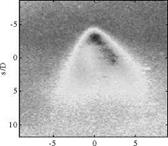
Using the same impinging jet facility running under different geometry and flow conditions, Guille (2000) conducted PSP and TSP measurements for a direct comparison of an intensity-based CCD camera system with a fluorescent lifetime imaging (FLIM) system developed by the Defense Evaluation and Research Agency (DERA) in Britain (Holmes 1998). The FLIM system consisted of an array of modulated LEDs, a phase-sensitive CCD camera, a modulation control box with an analog-to-digital converter, and a PC for image acquisition and processing. The CCD full-well capacity was limited to 80,000 electrons. The camera can be modulated up to 300 kHz with a 95% modulation depth. The control box contained a computer-controlled frequency source, 12-bit A/D converter, computer interface, and modulation electronics. The image readout rate was limited by the data rate of the link between the control box and computer. The LED array, which was used as a modulated light source, was composed of 100 blue LEDs. The illumination output was 7 W/m2 at a distance of 50 cm. The fluctuation of the lamp was 0.1% per hour under laboratory conditions after a warm-up period of 5 minutes. The modulation frequency for the FLIM system was set to 150 kHz in their experiments. Figures 9.62 and 9.63 show the temperature distributions and pressure coefficient distributions obtained by the intensity-based CCD camera system and FLIM system, respectively, where the coordinates were normalized by the nozzle diameter (D). The pressure coefficient Cp was defined as Cp = (p – patm )/qexit, where qexit is the dynamical pressure of
the jet at the exit. The intensity-based CCD camera system and FLIM system gave at least qualitatively consistent results. The results from the FLIM system were much noisier perhaps due to relatively high photon shot noise although it had an advantage of requiring no reference image.
![]()
![]()
![]()
![]()
![]()
![]()
![]() 00 99 298 297 296 295
00 99 298 297 296 295
Fig. 9.62. Temperature distributions obtained using (a) the intensity-based CCD camera system and (b) the FLIM system. From Guille (2000)
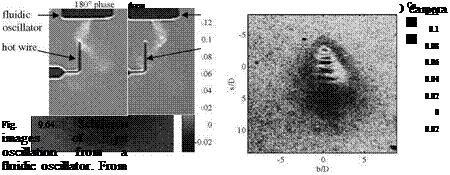 |
Sakaue et al. (2001) utilized an oscillating nitrogen impinging jet generated by a miniature fluidic oscillator to test the time response of several porous PSP formulations: anodized aluminum (AA) PSP, thin-layer chromatography (TLC) PSP and polymer/ceramic (PC) PSP. The frequency response of AA-PSP, TLC – PSP and PC-PSP measured previously in a shock tube was 12.2 kHz, 11.4 kHz and 3.95 kHz, respectively. Figure 9.64 shows Schlieren images visualizing the flow structures of an unsteady nitrogen jet from a fluidic oscillator.
Figure 9.65 is a schematic of the experimental setup for oscillating jet experiments. A porous PSP sample was placed under a fluidic oscillator in parallel to the nozzle centerline. A blue LED array was used as an excitation light source and a Photometrics 12-bit CCD camera (512×752 pixels) was used to capture PSP images through a long-pass filter (>580 nm). The excitation light source was pulsed and synchronized with flow oscillation through a pulse generator based on the flow structure signature sensed by a miniature microphone. A light pulse width was 12 |j. s, corresponding to 6% of a flow oscillation period
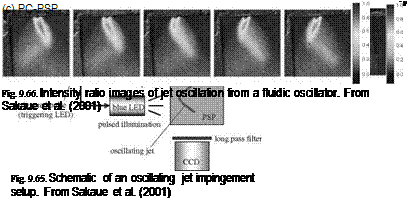 |
 when the fluidic oscillator was operated at 5 kHz. By controlling a trigger delay in the pulse generator, flow images at different phases were obtained. Figure 9.66 shows the luminescent intensity ratio images visualizing the flow structures of the impinging nitrogen jet at different phases obtained using AA-PSP, TLC-PSP and PC-PSP. The flow structures visualized by all three PSPs were similar to those observed in the Schlieren images. TLC-PSP images and AA-PSP images were captured in the total exposure times of 10 s and 11 s (50,000 and 55,000 light pulses), respectively. AA-PSP provided the sharpest images of the flow structures, indicating a high frequency response.


