Laser Scanning Measurements
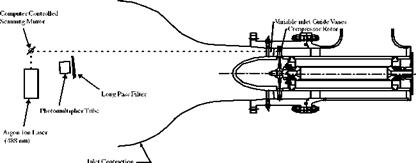
Using a laser scanning system, Liu et al. (1997a) and Torgerson et al. (1997, 1998) performed PSP measurements on rotor blades in a high-speed axial flow compressor (the Purdue Research Axial Fan Facility) and an Allied Signal F109 turbofan engine. They used Ru(dpp) in GE RTV 118 mixed with silica gel particles as PSP and Ru(bpy) in Shellac as TSP. PSP and TSP were coated on blades by dipping them into the paints, resulting in about 20-|jm thick coatings. Figure 9.47 is a schematic of a laser scanning system used for PSP and TSP measurements in the compressor facility where optical access is very limited. An air-cooled Argon laser with the filtered output at 488 nm was used as an illumination source; the laser was mounted upstream of the inlet contraction. The laser beam focused by a lens passed between upstream inlet guide vanes and illuminated rotor blades in a 1-mm diameter spot. Using a computer-controlled scanning mirror, a laser spot scanned across 21 spanwise (radial) locations along each blade. As a blade rotated and cut the laser beam, the beam illuminated the painted blade across its chord, and at least 100 data points were obtained across the chord, depending on the rotational speed of the blade. The luminescent emission from the paints was detected using a PMT attached with a long-pass filter for eliminating the excitation light. Data were acquired using a PC with a 12-bit A/D converter operating at the maximum rate of 500,000 samples/s. The pressure and temperature distributions were calculated using a priori calibration relations for both PSP and TSP.
|
Fig. 9.47. Laser scanning system for PSP and TSP measurements in a high-speed axial flow compressor with very limited optical access. From Liu et al. (1997a) |
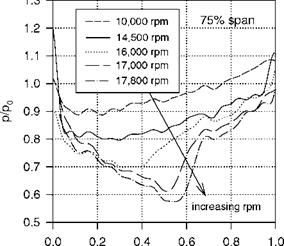
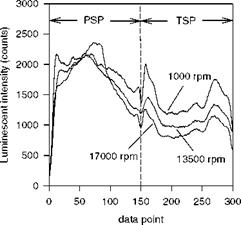
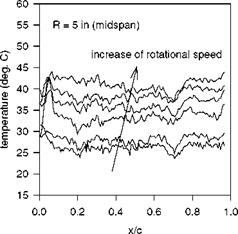
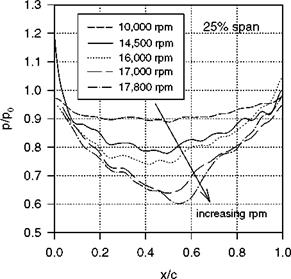
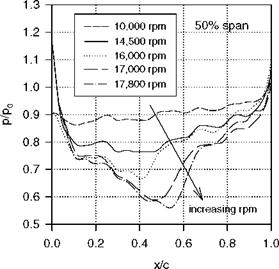
Figure 9.48 shows typical raw intensity signals from PSP and TSP on the suction surface of the painted blades at the rotational speeds of 1000, 13500 and 17000 rpm. As the rotational speed increased, the luminescent intensity of TSP decreased due to the increased surface temperature. A change in the luminescent intensity distribution of PSP was mainly caused by a pressure variation on the surface. In particular, a rapid decrease in the luminescent intensity, which occurred in a region from the 90th to 100th data point (0.6 to 0.67 chord) at 17,000 rpm, corresponded to a large pressure jump generated by a shock. The luminescent signal at the lowest speed of 1000 rpm was used as the reference intensity (nearly wind-off). Figure 9.49 shows the temperature distributions on the suction surface at 50% span at different rotational speeds. The temperature distributions appeared to be flat over a large portion of the chord, and the mean temperature increased with the rotational speed due to friction heating. The highest temperature on the blade surface was about 43oC at the speed of 17800 rpm. The pressure distributions on the surface were obtained using a priori calibration relation of PSP where the temperature effect of PSP was corrected based on the TSP data. Figures 9.50, 9.51 and 9.52 show the chordwise distributions of the relative pressure p/p0 at 25%, 50%, and 75% spans for different rotational speeds, where p0 is the upstream stagnation pressure (one atmosphere pressure in this case). The formation of a shock was evidenced by an abrupt increase in the pressure distributions at the speeds of 17000 and 17800 rpm. As the rotational speed increased, the shock became stronger and its location moved downstream. Figure 9.53 shows a composite representation of the pressure and temperature distributions mapped onto a surface grid of blade at the speed of 17800 rpm.
|
|
|
|
|
|
|
|
|
|
|
|
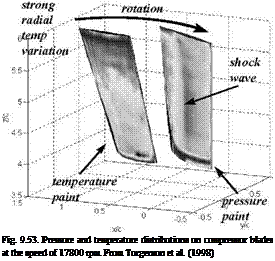 |
|
