Maximizing lift for single-element aerofoils
This section addresses the question of how to choose the pressure distribution, particularly that on the upper wing surface, to maximize the lift. Even when a completely satisfactory answer is found to this rather difficult question, it still remains to determine the appropriate shape the aerofoil should assume in order to produce the specified pressure distribution. This second step in the process is the so called inverse problem of aerofoil design. It is very much more demanding than the direct problem, discussed in Chapter 4, of determining the pressure distribution for a given shape of aerofoil. Nevertheless, satisfactory inverse design methods are available. They will not, however, be discussed any further here. Only the more fundamental question of choosing the pressure distribution will be considered.
In broad terms the maximum lift achievable is limited by two factors, namely:
(i) Boundary-layer separation; and
(ii) The onset of supersonic flow.
In both cases it is usually the upper wing surface that is the more critical. Boundary – layer separation is the more fundamental of the two factors, since supercritical wings are routinely used even for subsonic aircraft, despite the substantial drag penalty in the form of wave drag that will result if there are regions of supersonic flow over the wing. However, no conventional wing can operate at peak efficiency with significant boundary-layer separation.
In two-dimensional flow boundary-layer separation is governed by:
(a) The severity and quality of the adverse pressure gradient; and
(b) The kinetic-energy defect in the boundary layer at the start of the adverse pressure gradient.
This latter quantity can be measured by the kinetic-energy thickness, 6**, introduced in Section 7.3.2. Factor (a) is more vague. Precisely how is the severity of an adverse pressure gradient assessed? What is the optimum variation of adverse pressure distribution along the wing? Plainly when seeking an answer to the first of these questions a suitable non-dimensional local pressure must be used in order to remove, as far as possible, the effects of scale. What soon becomes clear is that the conventional definition of coefficient of pressure, namely
,, P~Pqo
is not at all satisfactory. Use of this non-dimensional quantity invariably makes pressure distributions with high negative values of Cp appear to be the most severe. It is difficult to tell from the variation of Cp along an aerofoil whether or not the boundary layer has a satisfactory margin of safety against separation. Yet it is known from elementary dimensional analysis that if the Reynolds number is the same for two aerofoils of the same shape, but different size and freestream speed, the boundary
layers will behave in an identical manner. Furthermore, Reynolds-number effects, although very important, are relatively weak.
There is a more satisfactory definition of pressure coefficient for characterizing the adverse pressure gradient. This is the canonical pressure coefficient, Cp, introduced by A. M.O. Smith.[54] The definition of Cp is illustrated in Fig. 8.1. Note that local pressure is measured as a departure from the value of pressure, pm, (the corresponding local velocity at the edge of the boundary layer is Um) at the start of the pressure rise. Also note that the local dynamic pressure at the start of the pressure rise is now used to make the pressure difference non-dimensional. When the canonical representation is used, Cp = 0 at the start of the adverse pressure gradient and Cp = 1, corresponding to the stagnation point where U = 0, is the maximum possible value. Furthermore, if two pressure distributions have the same shape a boundary layer experiencing a deceleration of (UjU^)2 from 20 to 10 is no more or less likely to separate than one experiencing a deceleration of (U/Uao)2 from 0.2 to 0.1. With the pressure-magnitude effects scaled out it is much easier to assess the effect of the adverse pressure gradient by simple inspection than when a conventional Cp distribution is used.
How are the two forms of pressure coefficient related? From the Bernoulli equation it follows that
 |
Therefore it follows that
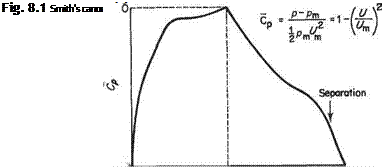 |
The factor (Um/Uoo)2 is just a constant for a given pressure distribution or aerofoil shape.
|
Fig. 8.2 Effects of different types of adverse pressure variation on separation |
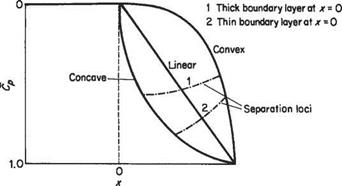
Figure 8.2 gives some idea of how the quality of the adverse pressure distribution affects boundary-layer separation. For this figure it is assumed that a length of constant pressure is followed by various types of adverse pressure gradient. Suppose that from the point x = 0 onwards Cp oc x™. For the curve labelled convex, m ~ 4, say; for that labelled linear, m = 1; and for that labelled concave, m ~ 1/4. One would not normally design a wing for which the flow separates before the trailing edge is reached, so ideally the separation loci should coincide with the trailing edge. The separation loci in Fig. 8.2 depend on two additional factors, namely the thickness of the boundary layer at the start of the adverse pressure gradient, as shown in Fig. 8.2; and also the Reynolds number per unit length in the form of Um/v. This latter effect is not illustrated, but as a general rule the higher the value of Um/v the higher the value of Cp that the boundary layer can sustain before separating.
It is mentioned above that the separation point is affected by the energy defect in the boundary layer at the start of the adverse pressure gradient, x = 0. Other things being equal this implies that the thinner the boundary layer is at x = 0, the farther the boundary layer can develop in the adverse pressure gradient before separating. This point is illustrated in Fig. 8.3. This figure is based on calculations (using Head’s method) of a turbulent boundary layer in an adverse pressure gradient with a preliminary constant-pressure region of variable length, jco – It is shown very clearly that the shorter xo is, the longer the distance Axs from x = 0 to the separation point. It may be deduced from this result that it is best to keep the boundary layer laminar, and therefore thin, up to the start of the adverse pressure gradient. Ideally, transition should occur at or shortly after x = 0, since turbulent boundary layers can withstand adverse pressure gradients much better than laminar ones. Fortunately the physics of transition, see Section 7.9, ensures that this desirable state of affairs can easily be achieved.
The canonical plot in Fig. 8.2 contains much information of practical value. For example, suppose that at typical cruise conditions the value of (U/Uoo)2 at the trailing edge is 0.8 corresponding to Cp = 0.2, and typically Cp = 0.4 (say) there. In this case any of the Cp curves in Fig. 8.2 would be able to sustain the pressure rise without leading to separation. Therefore, suitable aerofoils with a wide variety of pressure distributions could be designed to meet the specification. If, on the other hand, the goal is to achieve the maximum possible lift, then a highly concave pressure-rise curve with m ~ 1/4 would be the best choice. This is because, assuming that separation
|
|
|
Fig. 8.3 Variation of location of separation with length of initial flat plate for a turbulent boundary layer in a specified adverse pressure variation |
occurs at the trailing edge, the highly concave distribution not only gives the largest possible value of (Cp)TE and therefore the largest possible value of Um/UjE, but also because the pressure rises to its value at the trailing edge the most rapidly. This latter attribute is of great advantage because it allows the region of constant pressure to be maintained over as much of the aerofoil surface as possible, leading to the greatest possible average value of CP on the upper surface and, therefore, the greatest possible lift. For many people this conclusion is counter-intuitive, since it seems to violate the classic rules of streamlining that seek to make the adverse pressure gradient as gentle as possible. Nevertheless, the conclusions based on Fig. 8.2 are practically sound.
The results depicted in Fig. 8.2 naturally suggest an important practical question. Is there, for a given situation, a best choice of adverse pressure distribution? The desired goals would be as above, namely to maximize UmjUTE and to maximize the rate of pressure rise. This question, or others very similar, have been considered by many researchers and designers. A widely quoted method of determining the optimum adverse pressure distribution is due to Stratford.[55] His theoretically derived pressure distributions lead to a turbulent boundary layer that is on the verge of separation, but remains under control, for much of the adverse pressure gradient. It is quite similar qualitatively to the concave distribution in Fig. 8.2. Two prominent features of Stratford’s pressure distribution are:
(a) The initial pressure gradient dCpjdx is infinite, so that small pressure rises can be accomplished in very short distances.
(b) It can be shown that in the early stages Cp ос x1/3.
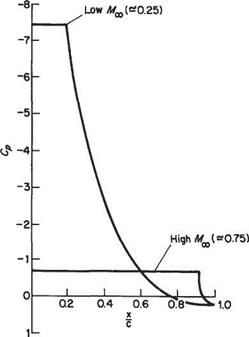
If compressible effects are taken into account and it is considered desirable to avoid supersonic flow on the upper wing surface, the minimum pressure must correspond to sonic conditions. The consequences of this requirement are illustrated in Fig. 8.4. Here it can be seen that at comparatively low speeds very high values of suction pressure can be sustained before sonic conditions are reached, resulting in a pronounced peaky pressure distribution. For high subsonic Mach numbers, on the
|
Fig. 8.4 Upper-wing-surface pressure distributions with laminar rooftop |
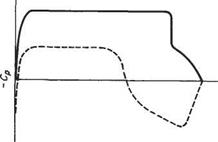
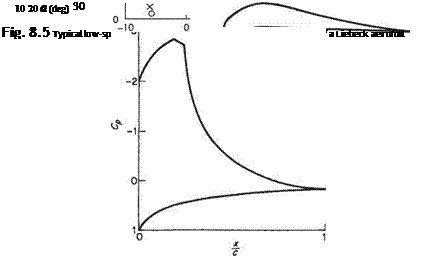
other hand, only modest maximum suction pressures are permissible before sonic conditions are reached. In this case, therefore, the pressure distribution is very flat. An example of the practical application of these ideas for low flight speeds is illustrated schematically in Fig. 8.5. This shows a Liebeck[56] aerofoil. This sort of aerofoil was used as a basis for the aerofoil designed by Lissama^ specially for the successful man-powered aircraft Gossamer Albatross and Condor. In this application high lift and low drag were paramount. Note that there is a substantial fore-portion of the aerofoil with a favourable pressure gradient, rather than a very rapid initial acceleration up to a constant-pressure region. The favourable pressure gradient ensures that the boundary layer remains laminar until the onset of the adverse pressure gradient, thereby minimizing the boundary-layer thickness at the start of the pressure rise. Incidentally, note that the maximum suction pressure in Fig. 8.5 is considerably less than that in Fig. 8.4 for the low-speed case. But, it is not, of course, suggested here that at the speeds encountered in man-powered flight the flow over the upper wing surface is close to sonic conditions.
There is some practical disadvantage with aerofoils designed for concave pressure- recovery distributions. This is illustrated in Fig. 8.6 which compares the variations of lift coefficient with angle of incidence for typical aerofoils with convex and concave pressure distributions. It is immediately plain that the concave distribution leads to much higher values of (Cx)max. But the trailing-edge stall is much more gentle, initially at least, for the aerofoil with the convex distribution. This is a desirable
cP° сГ о о о о Oq

![]() о° °°°
о° °°°
D°0vXfXxXx
![]()
 |
Ххх
Fig. 8.6 Comparison of the variations of lift coefficient versus angle of incidence for aerofoils with concave and convex pressure-recovery distributions. Re = 2 x 105.x, Wortmann FX-137 aerofoil (convex); o, Selig-Guglielmo S1223 aerofoil (concave)
Source; Based on Figs 7 and 14 of M. S. Selig and J. J. Guglielmo (1997) ‘High-lift low Reynolds number airfoil design’, Л/А4 Journal of Aircraft, 34(1), 72-79
|
Sonic line |
|
Fig. 8.7 Schematic figure illustrating a modern supercritical aerofoil |
feature from the viewpoint of safety. The much sharper fall in CL seen in the case of the aerofoil with the concave pressure distribution is explained by the fact that the boundary layer is close to separation for most of the aerofoil aft of the point of minimum pressure. (Recall that the ideal Stratford distribution aims for the boundary layer to be on the verge of separation throughout the pressure recovery.) Consequently, when the angle of incidence that provokes separation is reached, any further rise in incidence sees the separation point move rapidly forward.
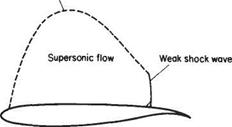
As indicated above, it is not really feasible to design efficient wings for aircraft cruising at high subsonic speeds without permitting a substantial region of supersonic flow to form over the upper surface. However, it is still important to minimize the wave drag as much as possible. This is achieved by tailoring the pressure distribution so as to minimize the strength of the shock-wave system that forms at the end of the supersonic-flow region. A schematic figure illustrating the main principles of modern supercritical aerofoils is shown in Fig. 8.7. This sort of aerofoil would be designed for Moo in the range of 0.75-0.80. The principles behind this design are not very dissimilar from those exemplified by the high-speed case in Fig. 8.4, in the sense that a constant pressure is maintained over as much of the upper surface as possible.


