Our heavyweight helicopter equal in the world does not have
In Rostov started production of the most load-lifting rotary-wing car The Russian holding «Helicopt[...]

Everything about aircrafts and helicopters. News and events in aviation worldwide. Civil, transportation, military helicopters and airplanes.

Everything about aircrafts and helicopters. News and events in aviation worldwide. Civil, transportation, military helicopters and airplanes.

Everything about aircrafts and helicopters. News and events in aviation worldwide. Civil, transportation, military helicopters and airplanes.

Everything about aircrafts and helicopters. News and events in aviation worldwide. Civil, transportation, military helicopters and airplanes.


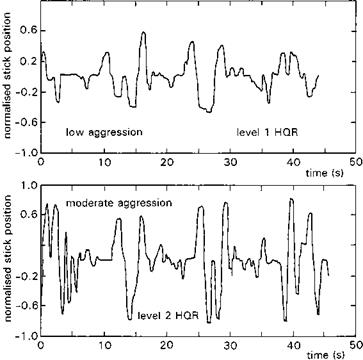
The chief attributes of agility are speed, precision and safety and all can be eroded by the increased difficulties of the operational situation. Not only the time pressures, but also the atmospheric conditions (e. g., gustiness) and UCE (see Section 2.2) will affect the agility factor and achieved HQRs significantly. In many of these cases there is a close correlation between pilot control activity, task difficulty and pilot rating, and in such cases the level of control activity can be related to pilot workload. Figure 2.45 shows the pilot’s lateral cyclic control for two different levels of aggression when flying a slalom MTE on the DRA’s advanced flight simulator (AFS); the details of this and other experiments will be provided in Chapter 7, but for now the varying frequency and amplitude levels are highlighted. The HQR levels are also noted on the legend,
|
Fig. 2.45 Time histories of lateral cyclic in a lateral slalom MTE |
|
|
indicating the degradation from Level 1 to 2 as the aggression is increased. In the case shown, the degradation corresponds to a task bandwidth increase.
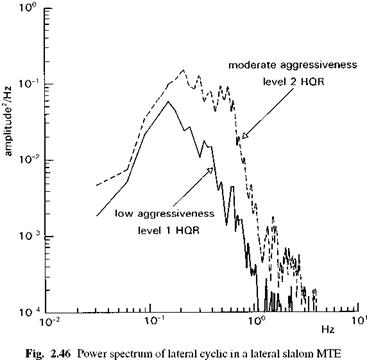
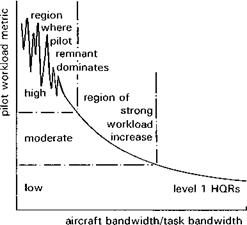
Another way of representing the pilot control activity is in the frequency domain, and Fig. 2.46 illustrates the power spectral density function for the lateral cyclic, showing the amount of control ‘energy’ applied by the pilot at the different frequencies. The marked increase in effort for the higher aggression case is evident, particularly above 1.5 Hz. There is evidence that one of the critical parameters as far as the pilot workload is concerned is the ratio of aircraft bandwidth to task bandwidth. The latter is easy to comprehend for an aircraft flying, for example, a sinusoidal slalom, when the task bandwidth is related to the ground track geometry and the aircraft ground speed. Bandwidths for more angular MTE tracks are less obvious, but usually some ratio of speed, or mean speed, to distance will suffice. Figure 2.47 illustrates conceptually the expected trend. A workload metric, e. g., rms of control activity or frequency at which some proportion of the activity is accounted for, is plotted against the bandwidth ratio. As the ratio increases one expects the pilot’s task to become easier, as shown. Conversely, as the ratio reduces, through either reduced aircraft bandwidth or increased task bandwidth, workload increases. There is a point at which the workload increases significantly, corresponding perhaps to pilot-induced oscillation onset, when the metric may no longer correlate with workload and where the control strategy is dominated by the so-called remnant, often reflecting confusion and a breakdown of the pilot acting as a quasi-linear element responding to task cue errors. Being able to detect incipient breakdown is important for establishing flying qualities boundaries and also for giving a pilot some advance warning of a potential high workload situation. Research in
|
Fig. 2.47 Conceptual relationship between pilot workload and the bandwidth ratio |
this field is still relatively immature, and most experiments rely heavily on subjective pilot opinion. To the author’s knowledge, there are no reliable workload meters, the human equivalent of a mechanical health and usage monitoring system (HUMS), used in operational service.