Tower Shadow
The effects of the tower wakes or “shadow” can be seen in the flow visualization of the downstream turbine shown in Fig. 13.20 where the bluff body-type flow from the upstream tower creates a velocity deficiency in the wind as it approaches the turbine disk. Experience suggests that there may be a 30% reduction in the local wind speed behind the tower. At a fundamental modeling level this problem is a good example where there is a need to distinguish properly the effects on the airloads on the blades arising from an assumed uniform change in a uniform AoA across the blade element from the effects resulting from a nonuniform velocity field. In an essentially incompressible flow, the former can be viewed as the net response to changes in AoA using superposition with the Wagner function (see Section 8.10). This is equivalent to assuming that at any instant the AoA is constant over the chord of the airfoil. This assumption is typical of what is used in many unsteady aerodynamic models for all modes of forcing. The latter can be viewed as the net response to a nonuniform vertical component of the velocity field using superposition with the KUssner function (see Section 8.11), which is the more accurate and correct assumption.
 |
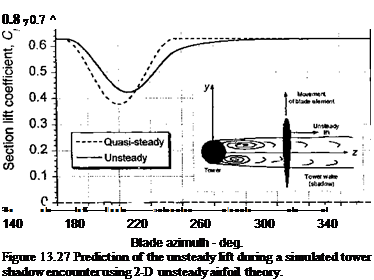
The velocity deficit in the flow behind the support tower can be modeled as a spatial variation in the velocity normal to the surface of the blade. In a 2-D model, the airfoil section moves rapidly through a velocity field, resulting in an attenuation in lift and a phase lag compared to the quasi-steady case. For the purposes of simple illustration, the problem can be modeled by assuming a 2-D airfoil traveling at unit velocity in an assumed velocity field normal to its chord given by w = 0.08 + 0.02 cos(5ty) where ф is in radians defined for the range 144° < js < 216° and w = 0.1 elsewhere. The results in Fig. 13.27 show
the differences in unsteady airloads produced using the steady and unsteady predictions. Clearly there are significant differences and the results emphasize again the importance of modeling unsteady effects if reliable quantitative predictions of the airloads are a goal. See also Munduate et al. (2003) for an analysis of the tower shadow problem and a comparison with measured airloads on the turbine blades.


