Modeling of Unswept Leading-Edge Separation
If we follow the previous assumptions that for high Reynolds number flows the viscous effects are confined within thin shear layers, then the irrotational flow outside these regions can be modeled by inviscid flow methods. The primary objective of this approach is to explain the pressure distribution obtained in separated flow; in some cases also the skin friction can be estimated. It seems clear that the model must be time-dependent and a large number of such methods can be found in the literature. Two excellent survey papers by Leonard14 24 and Sarpkaya103 describe and classify a large portion of the available literature on this topic. Some steady-state, two-dimensional models for flow separation14 3 extend the method of viscous/inviscid interaction of Section 14.2 and model the bubble created by the separated flow with additional sources or simply assume that the pressure is constant there. However, since flow visualization clearly indicates that high Reynolds number flow separation involves time-dependent wake shedding, we shall elaborate a
bit more on this approach. Note that the following two-dimensional models are intended to simulate the flowfield at the symmetry plane of a three- dimensional separation cell (as shown in Fig. 14.31).
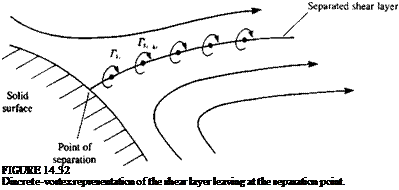
A typical two-dimensional time-dependent model for the separated flow over an airfoil can be constructed by taking any time-dependent potential flow solver (or any method of Chapter 11 with a time-dependent upgrade) and adding a separated shear layer model. Such a model is depicted schematically in Fig. 14.32, where the flow near a separation point is described. In order to solve the potential-flow problem, two additional unknowns characterizing the simplified effects of viscosity must be supplied to the potential flow solver and they are:
1. The location of the separation point or points. (Some information on the time dependent motion of this point, which may be very small, is valuable, too.)
2. The strength of the vortex sheet.
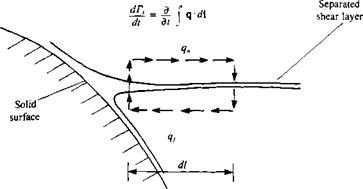
For example, let us use the unsteady thin-airfoil method of Section 13.10. It is assumed that the shape of the solid surface and location of the separation point, which is a function of the Reynolds number, are known (e. g., from experiments, flow visualizations, independent viscous calculations, etc.). The separated vortex sheet will be approximated by discrete vortices, as shown in Fig. 14.32 and their strength can be approximated by estimating dTJdt near the separation point (see Fig. 14.33), where the subscript s denotes “separated wake”. Using the definition of the circulation as in Eq. (2.36), the rate of circulation generation at the separation point is
![]()
 |
l=d dt dt
|
FIGURE 14.33 Nomenclature used to calculate the vorticity shed from a separation point. |
The integration path can be approximated by the simple rectangle shown in Fig. 14.33, which is placed near the separation point such that its upper and lower segments are in the potential flow region. If the upper velocity qu outside the boundary layer, and the lower velocity q€ within the separated bubble are known, then the integration on an infinitesimal rectangle becomes
^f=sJt^udl~ 4* dV> “ (4* = = *(q“~q2^ < 14‘14)
Here the vertical segments of the rectangle approach zero and their effect on Г, is neglected. In practice, the upper velocity is taken as the potential velocity above the separation point and is known (at least from the previous time step), whereas the lower velocity is close to zero. In this case the strength of the latest separated vortex becomes
Ts=^{ql~q2e)b. t (14.15)
where К is a circulation reduction factor and values of 0.5-0.6 are usually used. This latest separated vortex is placed along the streamline that started at the separation point (say at a distance [(Чи + Яе)/2 At from the separation point).
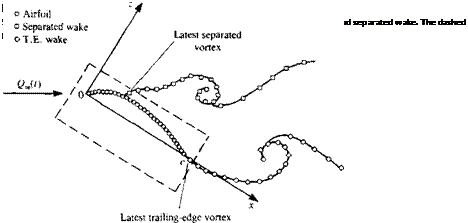
The momentary solution of the airfoil with the separated wake model is described schematically in Fig. 14.34. If the lifting airfoil is represented by N discrete bound vortices (circles in the figure) with unknown strength, then N equations representing the zero normal flow boundary condition can be specified on the N collocation points. The strength of the latest separated wake vortex TJ( is known from Eq. (14.15), whereas the strength of the latest vortex shed at the trailing edge TWt is calculated by using the Kelvin condition (Eq.
![]()
![]()
![]()
 |
(14.16)
So at each time step there are N + 1 unknown vortices Гь Г2,. . . , Г^, Г^, and N + 1 equations (N boundary conditions at the collocation point plus the Kelvin condition, Eq. (14.16)). The problem at each time step is solved exactly as described in Section 13.10, since the addition of the separated wake did not introduce any new additional unknown. Note that in this solution the Kutta condition is specified at the airfoil’s trailing edge (as a result of using the lumped-vortex element—see Section 13.10). The wake rollup at each time step can be performed in a manner similar to that described in Section 13.10 (see Eqs. (13.131) and (13.132)) and each vortex of the wake (both trailing edge and separated) will move with the local velocity (и, w), by the amount
(Ax, A. z)j = (u, w)j At (14.17)
Here the induced velocity (и, w), is the velocity induced by all the vortices (airfoil and wakes) in the field. Due to the singular nature of the vortices, instabilities can develop during the wake rollup routines and some methods10 3 use certain smoothing techniques to improve the wake rollup.
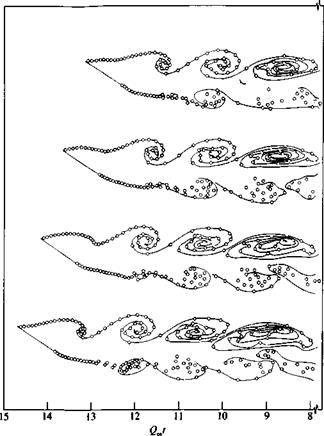
Results of such a calculation without using any wake rollup smoothing technique are presented in Fig. 14.35. The oscillation is obtained either by moving the separation point or changing the vortex strength. The front
|
c FIGURE 1435 Vortex wake rollup behind a separated flat plate. Front separation point was fixed at x/c = 0.05, a = 30°, and the time step is ixtQJc = 0.1. From Ref. 14.25. Reprinted with permission from Cambridge University Press. |
separation point in this figure is fixed at a distance of 5% chord from the leading edge.14 25
Another approach (e. g., see Ref. 14.24) is to solve the vorticity transport equation (Eq. (2.10)) by using discrete vortices. In this case the flow can be rotational and for thick bodies the Dirichlet boundary condition is applied to the Poisson equation for the stream function (V2V = £ = 0 inside a closed body). For example, the method of modeling the rotational boundary layer is described schematically in Fig. 14.36, where at a certain point in the boundary layer vortex elements are introduced. The strength and initial velocity of the newly introduced vortices can be estimated by assuming a certain effective boundary layer thickness de and outer velocity Ue (Ue is obtained from the
FIGURE 14.36
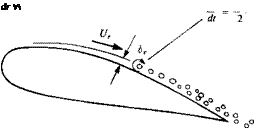 Model for forming discrete vortices in an attached boundary layer.
potential flow solution, whereas 6e can be estimated by using existing boundary layer data on flat plates). The initial velocity can then be approximated as Uel2 and the vortex strength is calculated by using Eq. (14.14) with q€ = 0 on the surface:
![]() dt 2
dt 2
In some models one set of (bound) discrete vortices is placed around the solid surface in a fixed position and the strengths are calculated at each time step by applying the Dirichlet boundary condition on the surface (see Fig. 14.37). During the second time step these vortices are allowed to translate with the flow and a new set of “bound” vortices is created. Results of such a calculation14 26 are presented in Fig. 14.38. Note that in this method both the tangential and the normal velocity components on the body are zero since the flow is rotational. However, at each time step a large number of new vortices is being created, compared to only two per time step in the method of Ref.
14.25. Consequently, some vortex number reduction schemes (by combining several nearby vortices) and wake rollup reshaping methods can be found in the literature.10 3 14 24
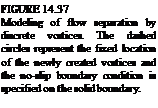 |
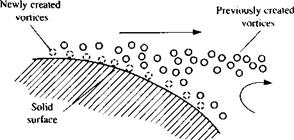 |
The extension of these two-dimensional models to three dimensions is somewhat more elaborate. For example, methods that are based on the stream function and solve two-dimensional rotational flows cannot be extended automatically to three dimensions (see Chapters 1 or 2). A possible simple
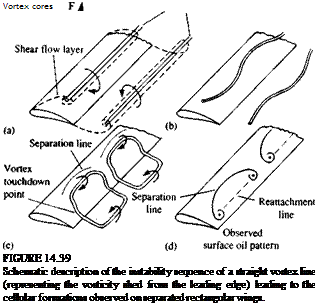 |
extension to the thin lifting surface of Section 13.12 was done in Ref. 14.27 mainly to explain the results of some flow visualizations obtained during high angle of attack testing of unswept wing general-aviation airplanes. An imaginary sequence leading to this model is described schematically in Fig. 14.39. The first frame (Fig. 14.39a) shows the time-averaged vortex core positions of the shear layers originating at the leading and trailing edges of a hypothetical two-dimensional flow. The figure shows only the most recent vortices, but the complete wake in the two-dimensional section will have a pattern similar to the Karman street shape of Fig. 14.27 (section AA). Also, if the wing geometry is purely two-dimensional (Ж = °°), then those vortex lines
Vort< "touch <j point

![]()
![]()
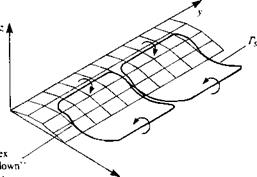 will be initially straight (hypothetically). However, a spanwise instability will develop14 28 similar to the instability of the trailing wake vortices (Fig. 14.4, and also Ref. 14.1), which will lead to the cellular patterns shown in Fig. 14.39c. Figure 14.39d shows the surface oil patterns appearing in Fig. 14.31, which can be explained by this simplistic model (note that the two edges of the mushroom shape correspond to the vortex ring “touch down” points).
The addition of large-scale vortex rings14 27 to the panel model of a thin wing for simulating the large-scale effects of this separated flow are shown in Fig. 14.40. In this model the location and spanwise width of the separated flow cells must be specified (based ‘on flow visualizations). Once this information is supplied to the otherwise potential flow solver, the fluid dynamic loads on the lifting surface can be calculated and Ref. 14.27 showed that the lift variation as a result of the separation line location can be explained.


